 Special Issue on Pictographs and Infographics [Aug Issue #5]
August 29, 2012
Hi,
In this special issue, we cover ideas and tutorials on info graphics and pictographs to help you add some spice to your next presentation.
Hope you enjoy them!
- Create Interesting Pictographs in PowerPoint
- Creative Doughnut chart Info graphics
- 5 PowerPoint Infographics Showing Percentage Completion
- Info graphics in PowerPoint to show Percentage Composition
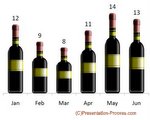 Create Interesting Pictographs in PowerPoint
Find a simple 3 step tutorial to convert your boring column or bar charts into interesting pictographs in PowerPoint. Discover creative ideas to spice up your data presentations.
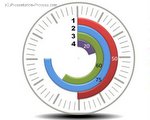 Creative Doughnut chart Info graphics
Discover creative ways to use Doughnut chart. Find info graphic ideas that make your data slides look interesting and memorable.
 5 PowerPoint Infographics Showing Percentage Completion
Find creative ways to show the concept of ‘percentage completion. Make your slides attractive and your message memorable.
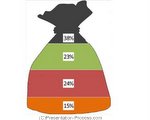 Info graphics in PowerPoint to show Percentage Composition
Use creative info graphics in PowerPoint to show percentage composition. Find creative ideas that make your message memorable.
You can forward this email to your friends.
If you received this newsletter as a forward, You can Subscribe Here>>
Quick Note:
Please Display Images in your email setup to see this newsletter correctly.
Happy Presenting!

Join 700+ Followers on Twitter: @PresentProcess
Join 15000+ Likes on Facebook:PresentationProcess
Channel On Youtube: PresentationProcess
