
Top 5 Shared Articles [Oct Issue #2]
October 10, 2012
Hi,
Here is the top 5 most viral content on Presentation Process:
These are articles that have been shared a lot and read a lot over the past many weeks:
Make your presentation memorable with these timeline ideas.
2) 5 Creative Presentation Ideas
This is one of our most popular articles ever. Here is your chance to read it, if you have missed it before.
3) How to animate PowerPoint Table
An innovative tutorial to help you animate tables in PowerPoint. 4) Data Presentation – 5 PowerPoint Tips
5 tips to make your presentation clearer and more memorable.
5) Using Visual Metaphors for PowerPoint Charts
This article covers one of the most effective ways to make your audience visualize and understand complex concepts i.e. using relevant metaphors.
1 Slide Contest Winner for October 2012:
Trivikram from India created this Yin Yang Symbol from our PowerPoint 2010 Tutorials section and gave it his own spin with 3D and Bevel. He also sent us a small element created with PowerPoint effects.
He wins 10 PowerPoint Charts Templates created by Presentation Process.
Congratulations on winning the contest this month!

Keep a watch out every month for this contest in the newsletter.
New Creative Chart Ideas this week:
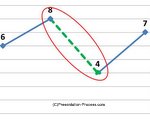 PowerPoint Chart Tips for Highlighting
Find some useful PowerPoint Chart tips to highlight certain portions of a data driven chart. Follow these tips to make your data slides remarkable.
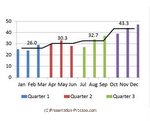 Chart Variations to Compare Quarterly Performance
Find some useful PowerPoint Chart variations to compare performance across four quarters. Get inspired to use the ideas in your next business presentation.
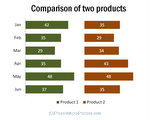 Chart Ideas to Compare 2 Products
Find useful PowerPoint chart ideas to compare performance of two products. Get inspired to use the ideas in your next business presentation.
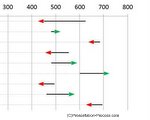 Creative Charts to Compare Performance
Find creative PowerPoint Charts to compare performance for two periods. See how some simple tweaks can lead to remarkable charts that convey your message effectively.
You can forward this email to your friends.
If you received this newsletter as a forward, You can Subscribe Here>>
Quick Note:
Please Display Images in your email setup to see this newsletter correctly.
Happy Presenting!

Join 700+ Followers on Twitter: @PresentProcess
Join 15000+ Likes on Facebook:PresentationProcess
Channel On Youtube: PresentationProcess
Back to Back Issues Page
