Home > Presentation Ideas > Presentation Graphics > BCG Matrix Template
A BCG matrix can be portrayed in a number of ways. Find the typical variations and how to create these templates using PowerPoint.
A quick word about BCG matrix template:
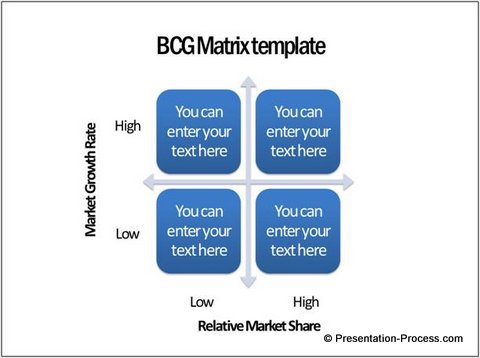
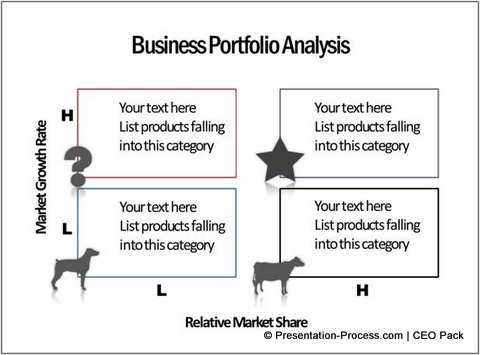
BCG matrix is a useful strategic planning model developed by Boston Consulting Group in 1970s. It is used for business portfolio analysis. The ‘BCG growth-share matrix’ positions different product lines based on Market Growth and Market Share in relation to the main competitor.
It is a common template used by many marketing and strategic consultants. The usual way to create a BCG template is to use SmartArt Matrix option. A typical matrix template looks like this:
Let us see some variations of the template and learn how to create them:
The Scatter Graph version:
Take a look at the following version:
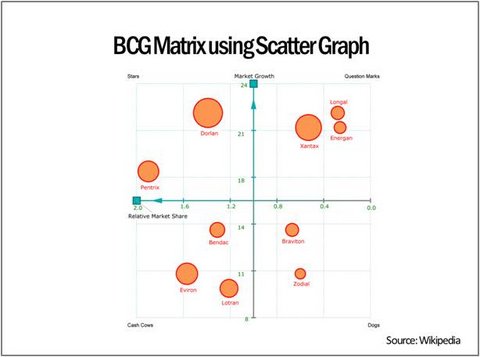
To create this version, first rank the products you want to analyze based on their Relative Market Share and Market Growth. Plot them on a XY scatter graph. You will be able to identify product clusters that fall into one of the four categories:
- Low share and Low growth rate – Dogs
- Low share and High growth rate – Question marks
- High share and High growth rate – Stars and
- High share and Low growth rate – Cash cows
The area of the bubble typically represents sales value. Once you have your products classified into groups based on the above logic, you can decide on your future strategy.
Related: Creative Ideas to represent Strategy
The conceptual version:
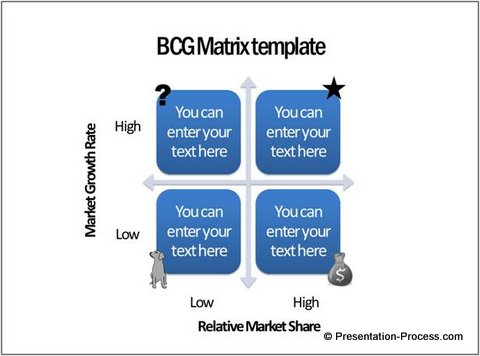
Sometimes you need a BCG template with relevant icons to explain your strategy after you made the product classification. In such cases, using simple icons like the following can serve the purpose:
Related : 5 creative Market Analysis Templates
Professional version of the matrix:
When you want to make a presentation to your clients or key stakeholders, it helps to have more professional looking templates like the ones you see here:
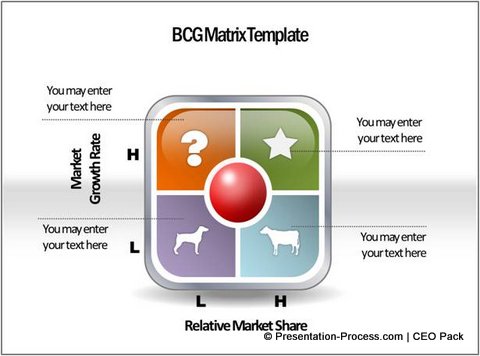
A 2 X 2BCG Matrix showing relative market share and growth rate

Here are BCG matrix showing business portfolio analysis…
Source: PowerPoint Matrix Diagrams from CEO Pack
The above BCG Matrix template ideas are part of our ‘750 + PowerPoint Charts and Diagram Templates pack for CEOs’. They provide…
Options for business presenters and consultants
When you buy professional PowerPoint templates for critical business presentations, it might help to check if the service provider knows a thing or two about the ‘business use’ of the templates they sell. Since the slides you use, reflect your awareness and credibility – you need to be doubly careful.
If you want to be sure, we recommend you take a look at our PowerPoint Charts & Diagrams CEO Pack . The pack has 750 fully editable diagram templates that help you communicate your business ideas and concepts accurately. What is more, the templates are extremely easy to use. You just need to copy our diagrams to your slides, replace the sample text and your presentation gets ready in no time.
Here are some consulting diagrams samples from the pack:
![powerpoint-pest-6[1]](https://www.presentation-process.com/wp-content/uploads/powerpoint-pest-61.jpg)
![v-diagram-5[1]](https://www.presentation-process.com/wp-content/uploads/349x262xv-diagram-51.jpg.pagespeed.ic.GQC2fXSVuK.jpg)
![powerpoint-swot-16[1]](https://www.presentation-process.com/wp-content/uploads/349x238xpowerpoint-swot-161.jpg.pagespeed.ic.Ulle2KGQ_H.jpg)
Why waste time creating your slides from the scratch, when you have such reliable and high quality resource available off the shelf? Click here to know more and download CEO Pack
Things to note while using BCG growth share matrix templates:
There are a few aspects that you may keep in mind when you include a BCG Matrix template in your presentations. They are:
- Not everyone is aware of BCG matrix. So, it is essential to explain the icons and set the context before you show the categorization. We have seen a number of instances where consultants forget this and leave the audiences wondering about the icons.
Remember: Without a proper context, the icons in the template look like frivolous decoration
- Don’t let the large icons hijack your audience attention. We’ve seen consultants using elaborate animation for the icons and losing audience attention in the process.
- Use the icons as guideposts for the rest of the slides. For example, you can use a ‘Star’ icon in the corner of the slide while discussing about products that have high share and high growth rate. This helps your audience stay with the context of your presentation all through.
There are more articles on consulting diagrams as well as a huge collection of PowerPoint tutorials on this site. You can browse more of them here…
Related: Balanced Scorecard Template Ideas
Related: Improve Venn Diagram with Custom Animation
Return to Top of BCG Matrix Template Page
