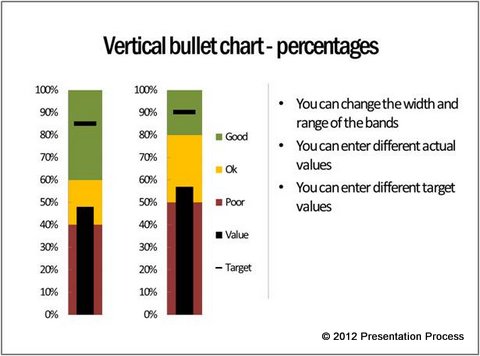
Part of : 320+ Visual PowerPoint Graphs Pack
Widest Variety of Data-Driven Graphs & Infographics for PowerPoint
Data-Driven Box Plot in PowerPoint

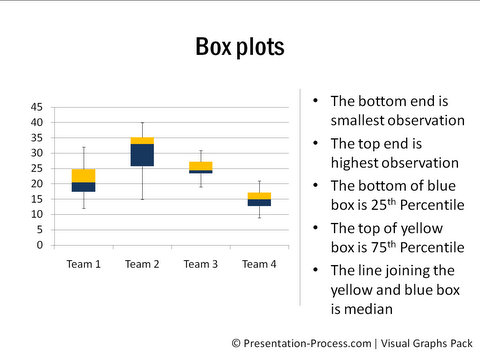
Description: A box plot shows groups of data through their five number summaries. They are the smallest observation, lower quartile, median, upper quartile and highest observation. This is most often used to represent stock performance.
Though box chart is not a native chart of PowerPoint, the slide allows you to create the chart by just editing relevant numbers in the worksheet.
Box and Whisker Chart in horizontal orientation
| Line Graph to Compare Stock
|
Candle Stick Chart

High Low Close Chart
| Chart with Volume
|
Open High Low Close Chart with Volume


