
From: PowerPoint Graphics, Concepts & Diagrams CEO Pack 2
Instantly download 815+ fully editable PowerPoint Graphics for CEOs.
Represent even MORE business ideas visually.
Creative Cause and Effect Models
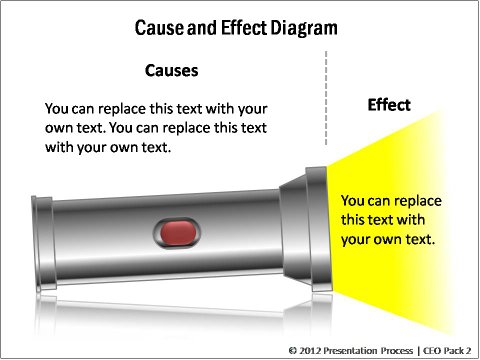
Description: Here are 52 alternatives to convey the concept of cause and effect. Each model conveys a different aspect of the theme. Some variations of the concept template are: fishbone diagram, spider diagram, decision tree, multiple influencing factors, three factors leading to one outcome, one factor leading to multiple outcomes, amplification of impact, factors contributing to the bubble, stage wise progression etc.
The keywords for this set are: Root cause chart, 5 whys, defect root cause analysis, and fault tree diagram.
Contributing Factors
Idea that moved us ahead | Influencing Factors
 |  |
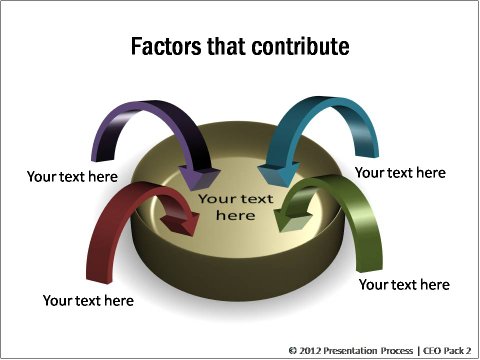
Factors that contribute to an Issue
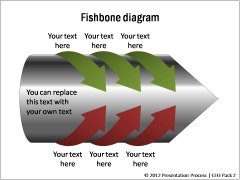
Way Forward for Change | Fishbone Diagram
 |  |
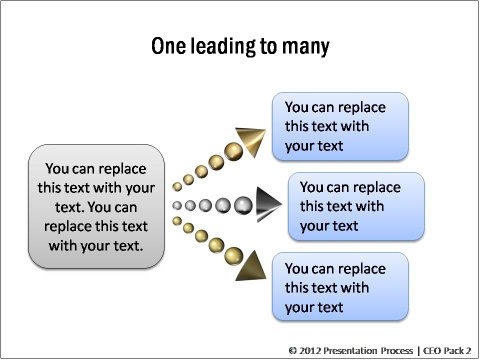
Results of an Activity | One leading to many
 |  |
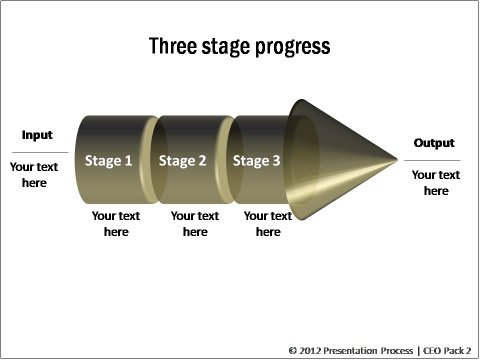
3 Stages of Process
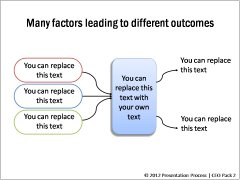
Contributing Factors to an Idea
 |  |
Multiple Factors and one outcome
 |  |
Cause and Effect Model

Cause and Outcomes in Different Directions
 |  |
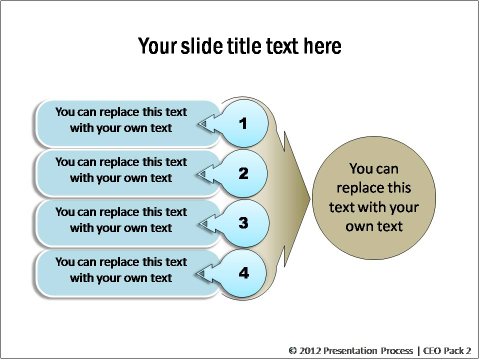
Various Points Leading to One Conclusion
 |  |
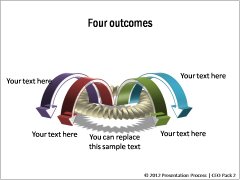
Multiple causes and Effects | 4 Outcomes
 |  |
Reinforcing Factors | Cause Effect Models Variation
 |  |
Bringing Factors together

Contributing Factors
 |  |
Elements supporting a cause| Increasing Impact
 |  |
Elements supporting a cause
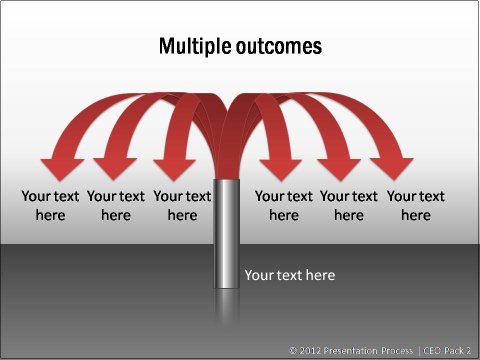
Multiple Outcomes & Events
One cause Leading to many outcomes
Amplification of Impact | Change and Demerger
 |  |
Multiple Outcomes | Ideas Emerging
 | 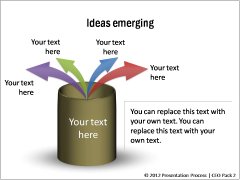 |
4 Results from an Idea
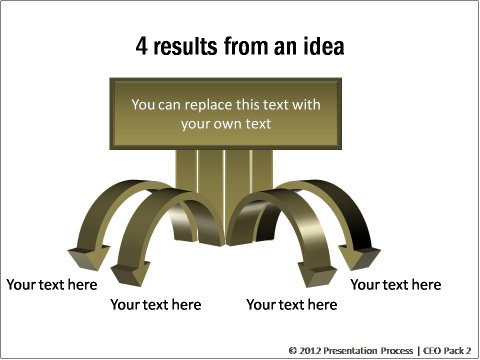
Factors contributing to the bubble | Leading Factors
 | 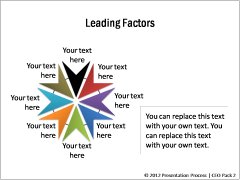 |
6 Outcomes | One Leading to Many outcomes
 | 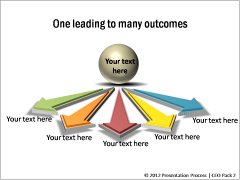 |
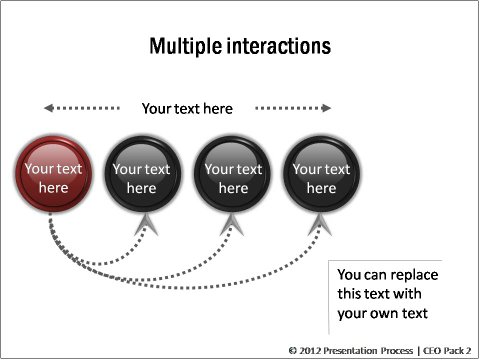
Multiple directions of interactions
Multiple causes | Stage wise progression
 |  |
Multiple Outcomes: 3D PowerPoint Cause and Effect Models

Changes before and After | Spider Diagram
 |  |
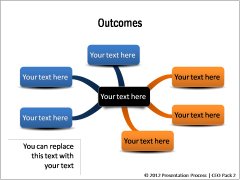
Multiple Outcomes
2 Sets of outcomes from a core Idea | A Range of outcomes
 |  |
Decision Trees and Branching
 |  |
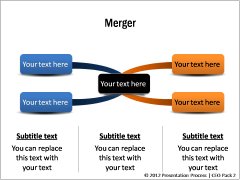
Decision Tree | Merger
 |  |
2 Step Decision Tree

Related PowerPoint Graphics in CEO Pack 2 |
|
|


 |  |
Return to Top of Cause and Effect Models Page