Home> All PowerPoint Tutorials > PowerPoint Models > Decision Tree in PowerPoint
Learn to draw creative decision tree diagram in PowerPoint. Follow these simple step by step instructions to create this useful diagram for your business presentations.
The Decision tree in PowerPoint you’ll learn is:
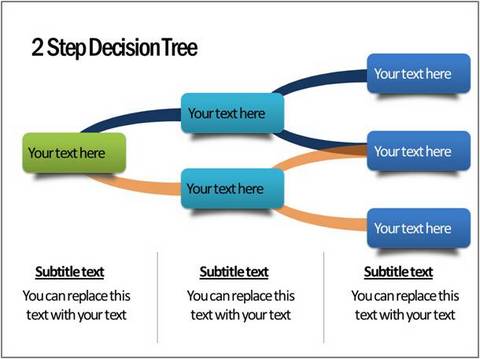
The diagram is stylish yet functional. These types of diagrams are quite useful in strategy related presentations.
Here are some applications of the Decision tree diagram:
- Use them to indicate outcomes of decisions taken at various points of the goal achievement process
- Use them to indicate the probability of occurrence of various results based on action taken
- Use them to illustrate various alternative paths to complete a project
Let us learn to create this diagram in a simple step by step way.
Step 1: Creating the branches
The attractiveness of the diagram depends on the shape of the branches. Go to Auto shapes menu and draw two overlapping elliptical shapes using the ‘Oval’ tool:
 Select the outer ellipse first and then the inner ellipse while holding down the ‘Shift’ tab. Click on ‘Shape Subtract’ option on your Format – Merge Shapes Menu.

Note: If you are using PowerPoint 2010, you will need to set up this option in your Quick Access Toolbar. To set up your quick access toolbar you may go want to go through this tutorial that teaches you the process.
You will get the following result:
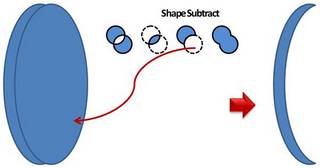 You can cut this shape in two halves using a rectangle as shown below:
 You can rotate the shape by 90° and use it as the branch for your decision tree. You can use different ‘Shape fill’ colors to suit your requirements.
Related: Tutorial for Spiral Model
Step 2: Creating the nodes
You can use a rectangle, rounded rectangle or an ellipse to serve as nodes for your decision tree.

Here is an example of a simple decision tree in PowerPoint:
 The red node indicates unfavorable outcome and the green node indicates favorable outcome.
You can add as many branches and nodes as you want to suit your specific needs. Let us see some interesting variations of the diagram:
Variations of diagrams with branches and nodes:
All the PowerPoint diagram templates you see below are taken from our ‘CEO Pack Volume 2’. The pack has more than 815 PowerPoint Charts and Diagrams to help you visualize business ideas.
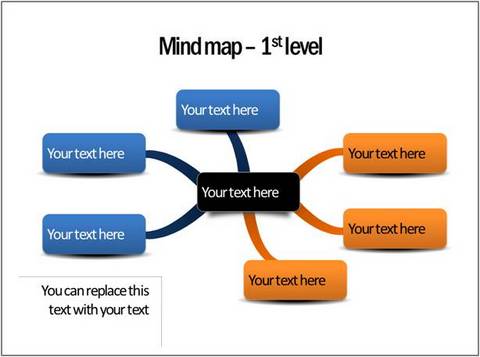
The following variation portrays the first level of Mind mapping process:
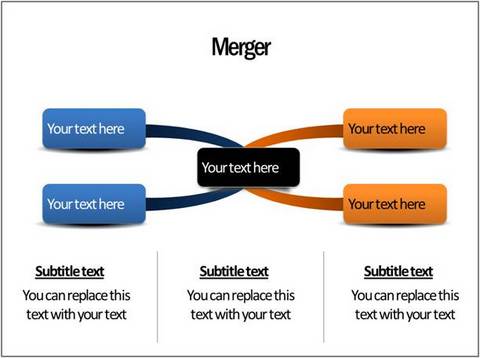
 In the following diagram template we show merger of two idea sets:
Source:Cause and Effect Models from CEO Pack 2
The template below uses elliptical nodes:
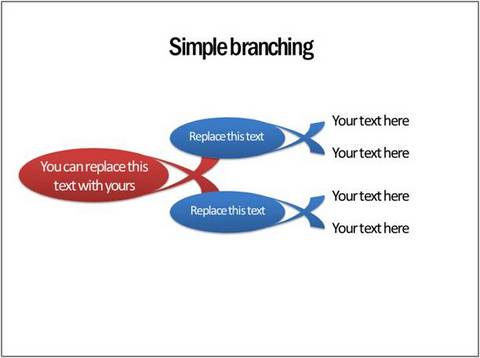 The following decision tree diagram template uses block arrows for branches:
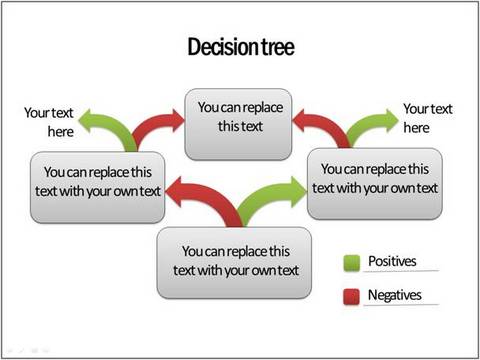 Thus, you can come up with your own variations of the diagram by using different types of branches and nodes.
Related: Create a Versatile PowerPoint Puzzle using PowerPoint 2010
Good diagrams have the power of grabbing and holding your audience attention. However, it is not easy to come up with beautiful looking diagrams for your business presentations, when you have the pressure of a deadline looming large.
That is why we came up with our ready-made PowerPoint Concepts and Graphics packs Volume 2 for CEOs. The ‘PowerPoint CEO Vol.2 ’ has more than 815 premium charts, diagrams, graphs and graphics to help you visualize a range of business ideas.
Why waste time creating your diagrams from the scratch when you have such a high quality solution available off the shelf? Please browse through our collection of diagram templates here>>
Related: Hierarchy Chart – The 3 Hidden Secrets in Smart-Art
