Part of : 320+ Visual PowerPoint Graphs Pack
Widest Variety of Data-Driven Graphs & Infographics for PowerPoint
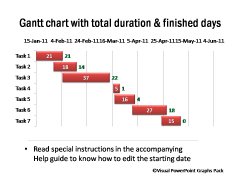
Gantt Chart Showing Progress

Description: A Gantt is used to illustrate project schedule. The data labels on the bars indicate the duration of tasks clearly.
Since a Gantt chart has become a common charting technique these days, most audience understands the chart quite easily. Use it in any project related presentations.The starting date, and projext schedule can be entered in worksheet to create this chart instantly.
Gantt Showing Duration
Project Duration and Days Remaining
| Total Duration & Finished Days
Gantt Chart with Progress Shown in Labels
|
Related Templates from Graphs Pack:
NEXT STEPS:
Features | License Terms | Testimonials Download SamplesContacts


