Home > All Tutorials > PowerPoint Tips > Group in PowerPoint
This is Part II of 2 part series which helps you understand Group in PowerPoint better. Find some interesting applications of the Grouping tool for business presentations.
Applications of Group in PowerPoint:
In Part 1 of this article, you learnt some interesting but less known facts about Grouping in PowerPoint. In this article, you will see how ‘Grouping’ helps you simplify some complex tasks while creating your business graphics. You will also find some example graphics created using the features we describe in this article.
Application 1. Create a matrix easily
Let us say you want to create a matrix of squares on your slide as shown below:
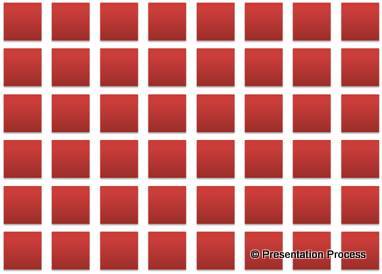
If you were to copy and place individual squares one by one in their position – you will take a long time to complete the task. You may not achieve perfect results too. A simpler way would be to use the power of ‘Grouping’ tool.
First make a copy of 1 square. Then select both the squares and make a copy. Copy all 4 squares and make a copy and so on.
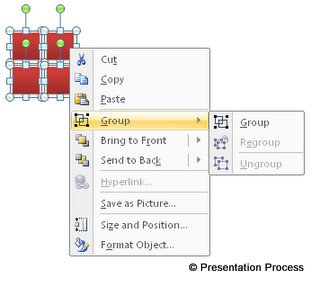 You will leverage the power of compounding in creating the row of squares. Once you distribute the squares in the row evenly – group the row. Now make multiple copies of the row and distribute them vertically. Your matrix is ready.
If you had not grouped the rows, you not only need to align each row of squares horizontally, you may also need to align each column of squares vertically. Thus, grouping helps you save time while giving you perfect results.
Take a look at the floor in the following diagram template created using the group in PowerPoint idea we just described:
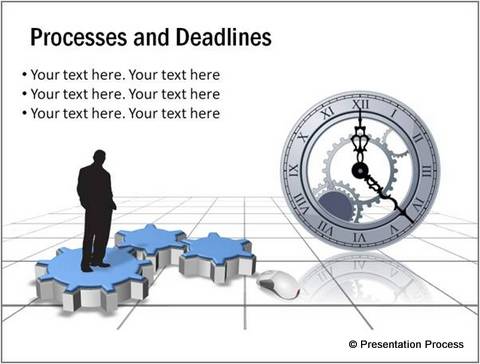
Tip: If you want to learn how to create 3D floor in PowerPoint, please refer to this article.
Application 2. Alter depth of elements in 3D
A good thing about grouped items in PowerPoint is – you can select the individual items in the group and alter their character. This comes in handy to create interesting 3D graphics. For example, take a look at the following diagram template:
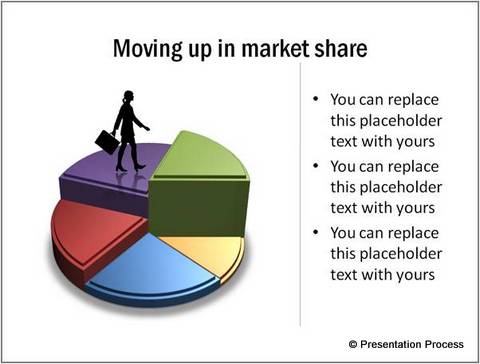 It is not possible to create the graphic by creating ‘pies’ of different heights and arranging them together. The right way is –
- Create a six segmented pie diagram
- Group the individual items together
- Apply 3D perspective to the group
- Select individual items and increase their depth
Here is a diagrammatic representation of the process:
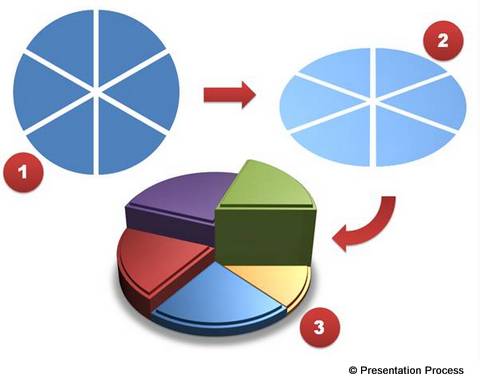 Note that it is also not possible to create pie charts of different heights with the data-driven graph function in PowerPoint.
Application 3. Create a step pyramid easily
Grouping tool comes in handy to create interesting graphics like ‘Step pyramid’ in PowerPoint. Take a look at the following diagram template which shows different levels of hierarchy in an organization:
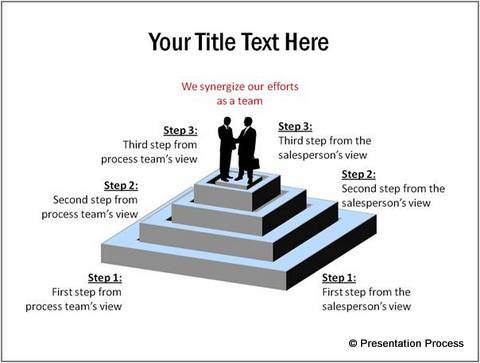 While it may be possible to create individual squares and stack them up one over the other – you save time by grouping the squares and altering the ‘distance from ground’ of individual squares as shown below:
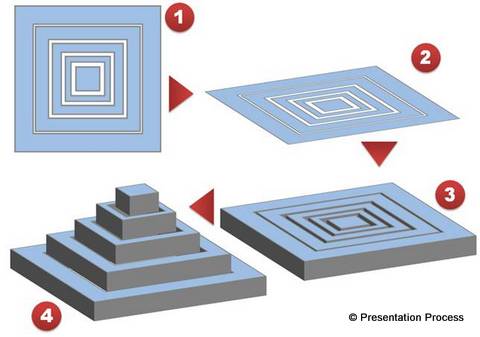
 | If you liked the diagram templates we have showcased in this article so far, you can find 750+ more of such templates in our PowerPoint Charts and Diagrams CEO Pack. They are fully editable diagrams created for busy business presenters. You can make over your presentations in minutes with this pack. Browse and see more details of the pack here >> |
Application 4. Shape combine in PowerPoint 2007 using Grouping
We know that tools like ‘Shape combine’ are available only in PowerPoint 2010 version. But, do you know that you can do ‘Shape combine’ in 2007 version by grouping the items?
Let us say we want to meld these two rectangles in the following diagram:
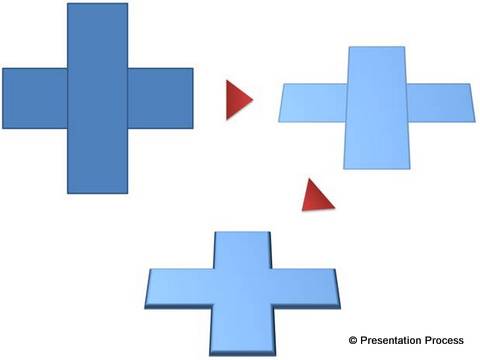
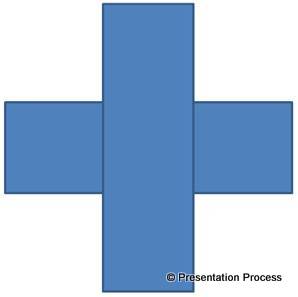 A simple way is to group both the shapes. Apply 3D perspective to the group and apply a bevel preset. Voila! The two shapes now fuse together seamlessly.
 You can find a trick to shape subtract in PowerPoint 2007 here >>
Application 5. Create a pivot for your clock graphic
One of the classic uses of grouping in PowerPoint is to create false Pivot for Spin animation. Let us say you want to animate the handles in the following clock graphic:
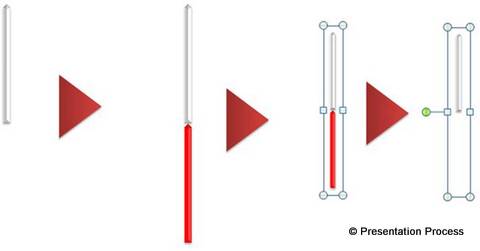
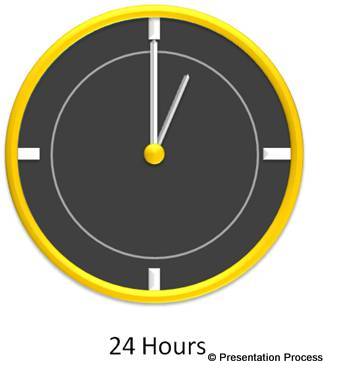 When you apply ‘Spin’ animation to the handles you’ll find that the handles spin around their own axis instead of spinning around the axis of the dial. A simple way to overcome the issue is
- Make a copy of the handle
- Place it at the bottom edge of the handle
- Change the transparency of the fill to 100%.
- Group both the shapes and apply Spin animation to the group.
Now, you will see the clock running properly.
 You can see the detailed spin animation tutorial here >>
Thus you can see that group in PowerPoint is versatile in its applications.
If you liked these PowerPoint tips, do leave us a comment below. You can find 200+ more Advanced PowerPoint tutorials on this site.
You may like : Creative Infographic Tutorial with Pencil Icon
