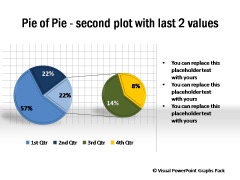
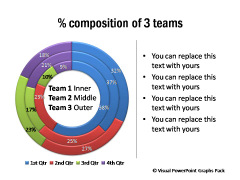
320+ Data-Driven Graphs & Infographics for PowerPoint. Beautiful Graphs to help visualize your data easily.
Widest Range. Easy to Use. Instant Download!

Named Charts
Marketing & Pyramid Charts | Speedometer Charts
Step Charts | Box & Whisker Plots
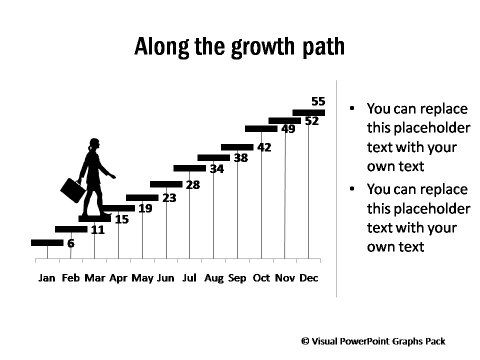
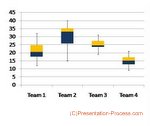
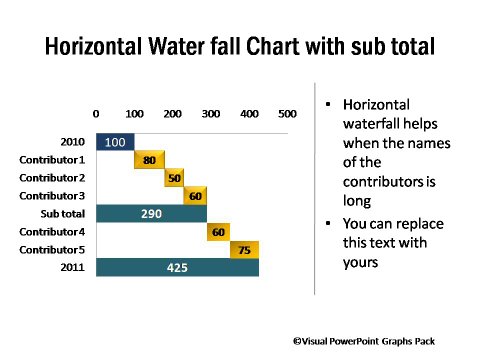
Waterfall Charts | Bullet Charts

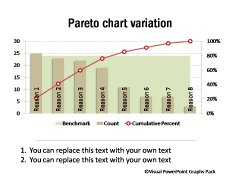
Thermometer Charts | Pareto Charts & Histograms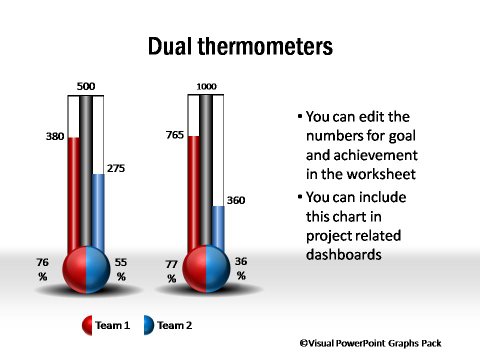
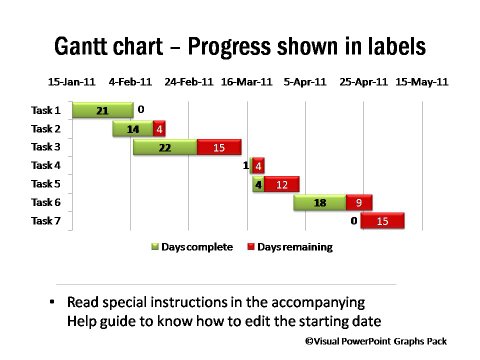
Gantt Charts |Yes or No & Butterfly Charts
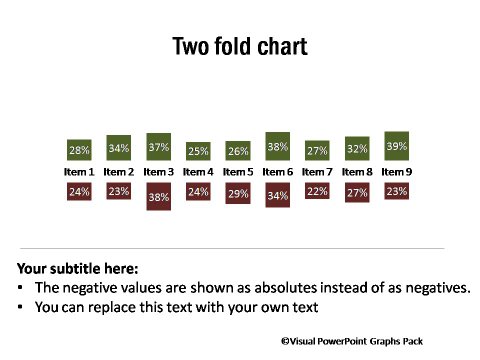
Data-Driven Infographics
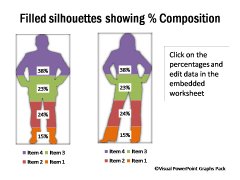
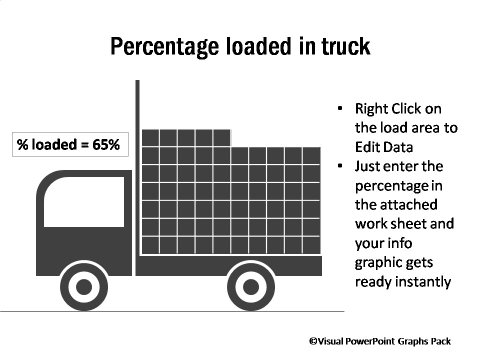
Percentage Composition |Percentage Completion
Chart Placeholders |Handdrawn Charts
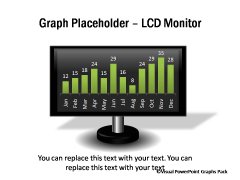
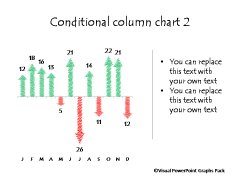
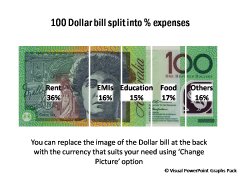
Currency Composition |Percentage Completion Dials
Value Added Charts
Dashboards |Project Management Charts
Display Winners & Underachievers
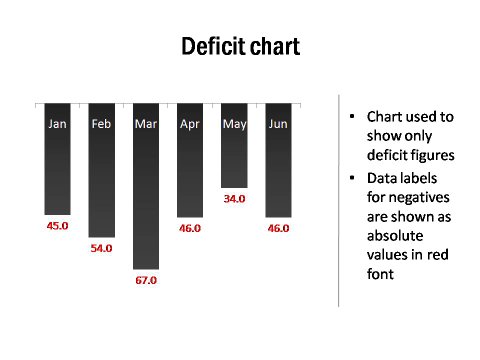
Minimum Maximum Values |Surplus and Deficit

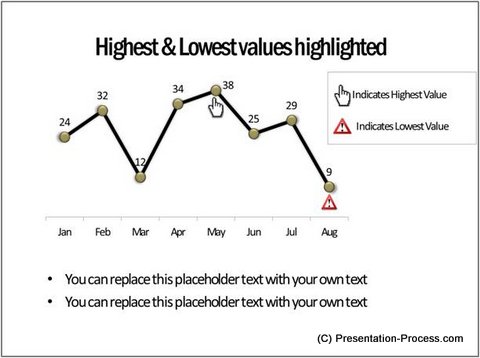
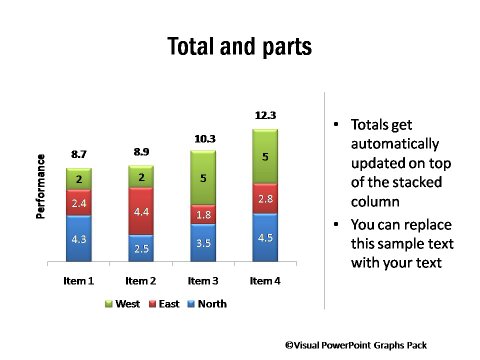
Total and Composition|Performance Across Quarters
Before & After Event |Performance vs Range

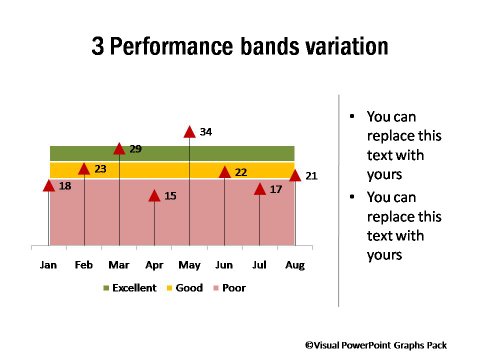
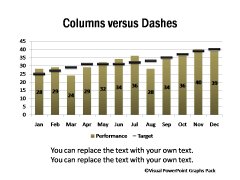
Performance Vs Target |Comparing ProductPerformance
Performance Across 2 years |Performance Gap Values
Conditional Charts | Sales Reporting Charts
Designer Charts
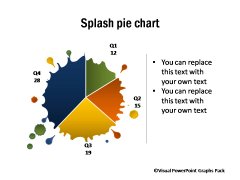
Pie Chart Templates |Bar Chart Templates
Column Chart Templates |Bubble Charts & Area Charts
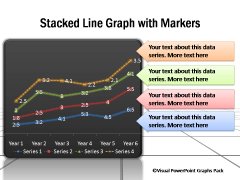
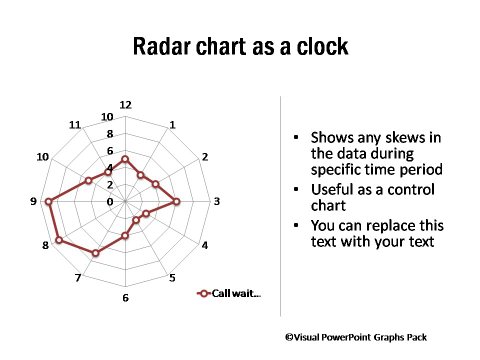
Line Charts | XY Scatter & Radar Charts
Pie Chart Templates with Second Level Details
Instant Download!
File Type: Pptx for PowerPoint 2007 & 2010 & Compatible Systems
Buy now and get $50 off
Price: $299$249

