
Part of : 320+ Visual PowerPoint Graphs Pack
Widest Variety of Data-Driven Graphs & Infographics for PowerPoint
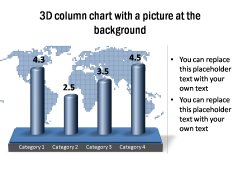
3D Gold Bullet Style Column Chart Template for PowerPoint

Description: A range of attractive column graphs, in 3D as well as 2D. Helps you represent your business data with insight and creativity. Each chart is different in the way it represents data.
This section includes pyramid charts and cones.
Chart Showing Gap Values
| 3D Clustered Chart
|


3D Cylinder Chart Variations
 |  |
3D Bullet Chart
Column Chart with Explanation Labels
3D Cylinder Stacked
| Stylized Columns
PowerPoint Graph with 100% Stacked Cylinder
3D Clustered Columns
|


Columns Showing Average Performance Variation

Stacked and Simple Pyramid Charts in 3D
 |  |
Interesting 3D Cone Chart

Related Templates from Graphs Pack:
|
|

