
Home > PowerPoint Diagram > PowerPoint Presentation Diagrams
Most presenters shy away from creating PowerPoint presentation diagrams, thinking it will be a time consuming process.
In this article you’ll learn shortcuts for creating diagrams in PowerPoint quickly by capturing the relationships between objects clearly.
PowerPoint Presentation Diagrams bottleneck:
As you read through the previous articles on creating diagrams, you might have realized that the process that takes the most time is the process of identifying the relationship between objects.
If you can overcome this bottleneck, you’ll be able to come up with some remarkable and accurate diagrams in a surprisingly short time.
Here is the quick way to creating PowerPoint Presentation diagrams fast:
Shortcut to categorize the relationships…
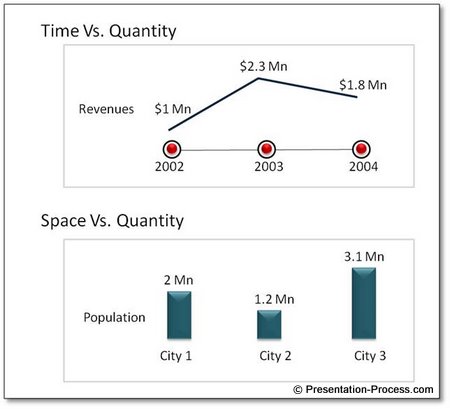
It is possible to categorize relationships between objects based on 3 simple factors. They are – time, space and quantity. Let’s give you some examples to explain the categories.
Relationship by Time:
Objects may relate in the order in which they occur. The best way to capture the relationship is by using a timeline. For example:
Examples of time relationships include:
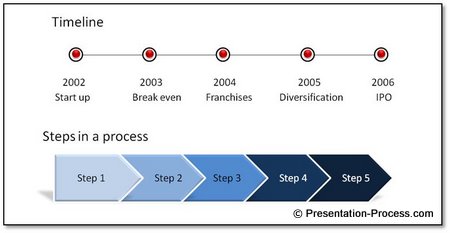
Timeline of Events like company history
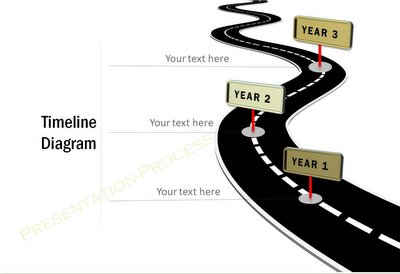
Sample Roadmaps from PowerPoint Charts CEO Pack
‣ Timeline of milestones to be achieved
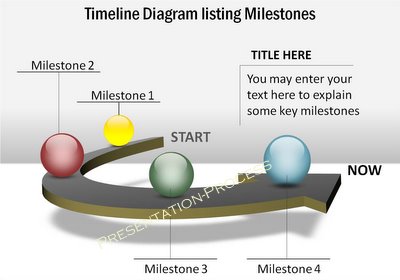
Sample Timelines from PowerPoint Charts CEO Pack
Process Flow Diagrams
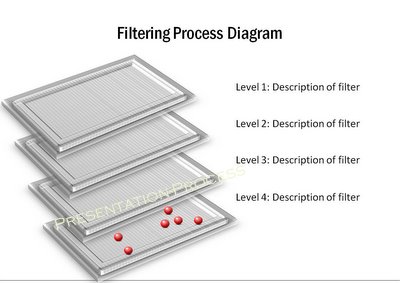
Sample Filters from PowerPoint Charts CEO Pack
Now, let’s move to the next relationship type…
Diagrams representing relationship by Space:
Objects may relate based on the way they are placed spatially. The best way to capture the relationship is by using a map. For example:
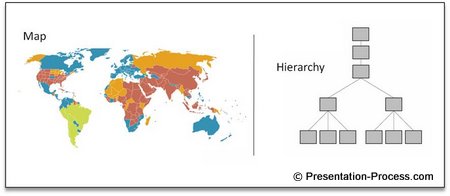
Examples of spacial relationships include:
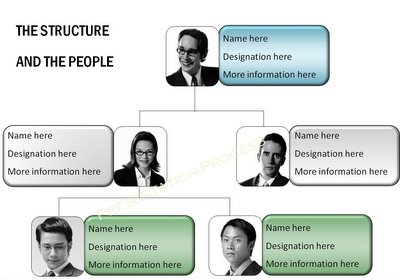
‣ Organizational Hierarchy
Finally, the last relationship type is…
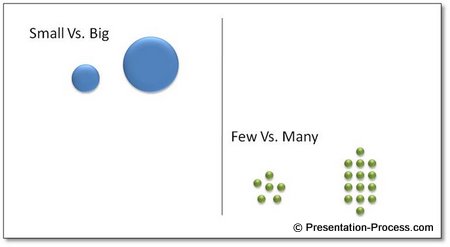
Diagrams representing relationship by Quantity:
Objects may relate based on the difference in quantity. The best way to capture the relationship is by using a chart or a conceptual diagram. For example:
Examples quantity relationships include:
‣ Comparison charts
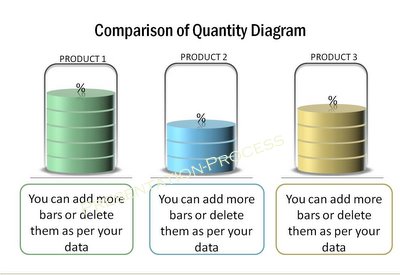
Sample Editable Charts from CEO Pack
‣ Graphs and Charts
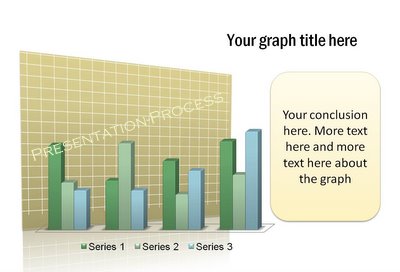
Many times, the relationship involves two factors. For example:
To conclude…
Classifying the relationships by these 3 factors – time, space and quantity are a good starting point to get a grip on the relationships. These are the most common relationships.
In case where there is no relationship like a bullet-point list, a simple visual diagram can capture the information like this…
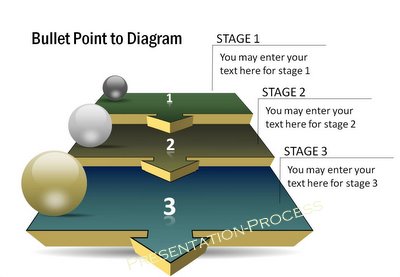
Sample Steps from PowerPoint Charts from CEO Pack
These shortcuts will help you get a head start in creating PowerPoint Presentation Diagrams for concepts and numbers.