Part of : 320+ Visual PowerPoint Graphs Pack
Widest Variety of Data-Driven Graphs & Infographics for PowerPoint
Waterfall Charts with Brick Style Blocks

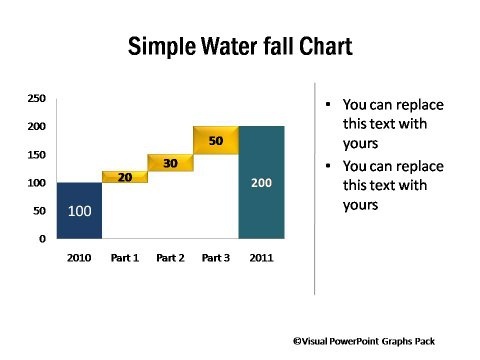
Description: A waterfall chart shows the cumulative effect of sequentially introduced values. You can add as many intermediate values as you want by editing the worksheet. The chart is quite useful for quantitative analysis of performance as it shows gradual transition of values over time.
Net Profit Shown as Waterfall – Just Enter your data to customize

Net Profit Derivation Shown in Horizontal Graph

Basic Waterfall Graph

Waterfall Graphs – Just enter your data to use

Related Templates from Graphs Pack:
NEXT STEPS:
| | | |


