Part of : 320+ Visual PowerPoint Graphs Pack
Widest Variety of Data-Driven Graphs & Infographics for PowerPoint
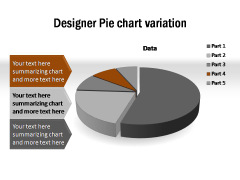
Designer Pie Chart Template in PowerPoint
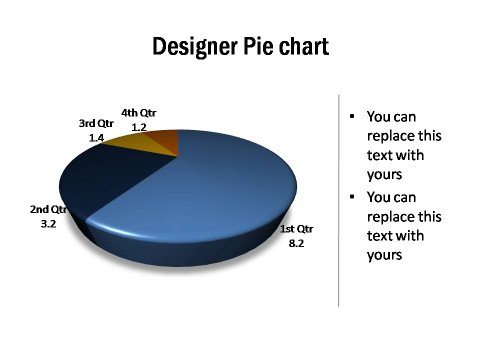
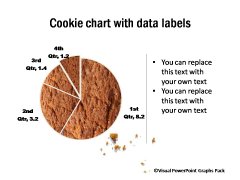
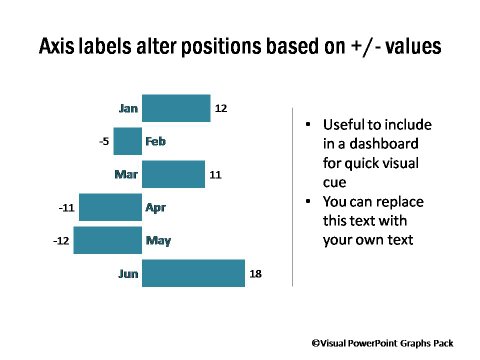
Description: A range of attractive data-driven pie and doughnut graphs, in 3D as well as 2D. Helps you represent your business data with insight and creativity.
Glossy Framed Designer Charts
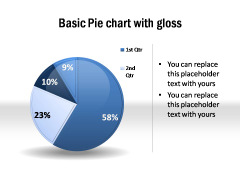
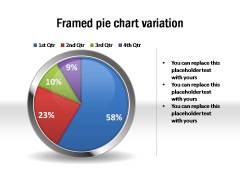 Pie with Gloss
| 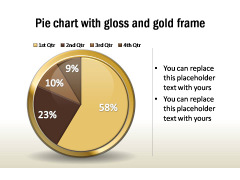 3D Data-Driven Chart
|
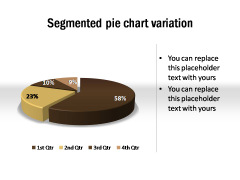
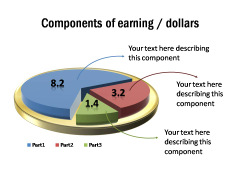
Stylized 3D Pie Charts showing break up
 |  |
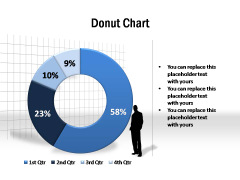
Donut Chart
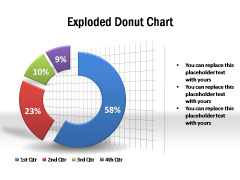
| Exploded Donut Chart
|
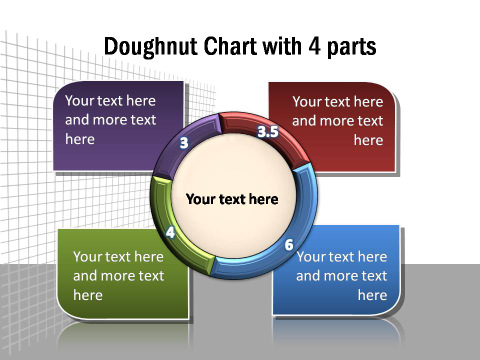
Donut Chart Template in PowerPoint with 4 Call outs
