Presentation Process | Creative Presentation Ideas

Get Creative PowerPoint Ideas to Makeover Your Business Slides from Presentation Process

  • Home
  • Articles
  • PowerPoint Training Courses
  • PowerPoint Templates Packs
  • LOGIN

Box Plot and Candle Stick Chart

Part of : 320+ Visual PowerPoint Graphs Pack

Widest Variety of Data-Driven Graphs & Infographics for PowerPoint

Data-Driven Box Plot in PowerPoint
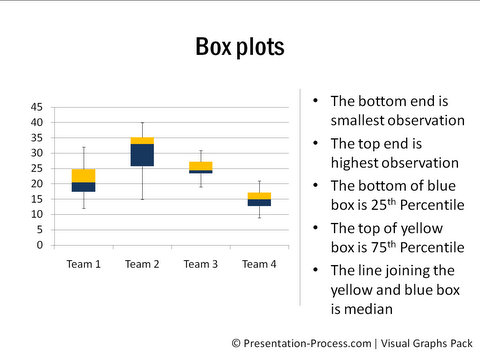
Box Plots
Description: A box plot shows groups of data through their five number summaries. They are the smallest observation, lower quartile, median, upper quartile and highest observation. This is most often used to represent stock performance.

Though box chart is not a native chart of PowerPoint, the slide allows you to create the chart by just editing relevant numbers in the worksheet.

Box and Whisker Chart in horizontal orientation

Box and Whisker Chart

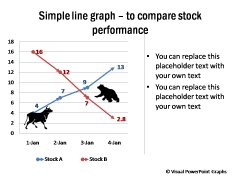
Line Graph to Compare Stock
Performance

Simple Line Graph

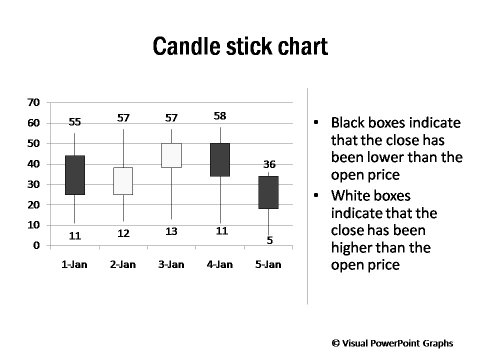
Candle Stick Chart

Candle Stick Chart

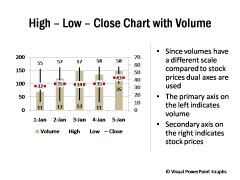
High Low Close Chart

High Low Close Chart

Chart with Volume

High Low Close Chart with Volume

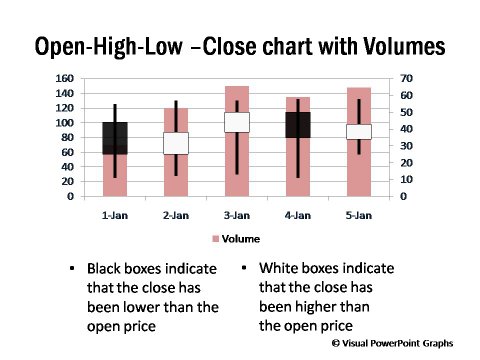
Open High Low Close Chart with Volume

Open High Low Close Chart with Volume

Related Templates from Graphs Pack:

Bullet Charts

Bullet Chart

Gantt Charts

Gantt Charts

NEXT STEPS:

Go to Gallery of Visual PowerPoint Pack View Demo of Visual Graphs Pack Pricing of Graphs Pack

Share this:

  • Click to print (Opens in new window)
  • Click to share on Facebook (Opens in new window)
  • Click to share on Twitter (Opens in new window)
  • Click to share on Pinterest (Opens in new window)
  • Click to share on LinkedIn (Opens in new window)
  • More
  • Click to share on Reddit (Opens in new window)
  • Click to share on Tumblr (Opens in new window)
  • Click to share on Pocket (Opens in new window)

Please Share Your Comments & Suggestions


Secured by PayPal

Key Features of Graphs Pack

  • Huge Variety of 320+ Graphs
  • Easy to Use & Edit
  • Completely Data-Driven
  • No Additional Software required
  • Get New insights from data

Browse All Graphs
in this Pack

NAMED CHARTS

Box Plot
Bullet Charts
Gantt Charts
Marketing Funnel & Pyramids
Pareto & Histograms
Speedometer Charts
Step Charts
Waterfall Charts
Thermometer Charts
Yes / No & Butterfly

DATA-DRIVEN INFOGRAPHICS

Handdrawn Charts
Percentage Completion Dials
Chart Placeholders
Pictographs
Visual Pie Charts
Currency Composition
Percentage Completion
Percentage Composition
Poll Result

FUNCTIONAL CHARTS

Dashboards
Conditional Charts
Min Max Values
Winners Underachievers
Project Management Charts
Surplus & Deficit
Sales Reporting Charts
Total & Composition

Performance Compared

Before & After Event
To Specified Range
To Target
Across Products
Across 2 Years
Across Quarters
With Gap Highlighted

ESSENTIAL CHARTS

Bar Chart
Column Chart
Line Chart
Bubble & Area Charts
Pie Charts
Pie Chart with Details
XY Scatter & Radar
 

OTHER

Download Samples

  • HOME
  • About Us
  • Contact Us
  • Privacy Policy
  • Terms of Service
  • Affiliates
  • Login
  • DMCA Protected

Copyright © 2010-2019 · Presentation-Process.com · All rights reserved ·
If you get inspired by any of the free material we post, we'd appreciate a link to the article in your Blog or website or Facebook ·

Copyright © 2019 · BDhire Presentation Process Theme on Genesis Framework · WordPress · Log in