
Home > Presentation of Data Page> Creative PowerPoint Chart
Find ideas to use creative PowerPoint placeholders for your charts that add context to your business slides. Make your data slides remarkable and your message memorable.
Why creative PowerPoint chart placeholders?
Sometimes data charts can look quite boring. This boredom may cost you dearly when making critical presentations to key business audience. Creative PowerPoint chart placeholders help you overcome this issue quite effectively.
Chart placeholders help you grab your audience attention by placing your charts in relevant visual context. They help you blend your chart as part of your overall story. They make your data slides visually interesting and make your message memorable. In this article, we will show you some creative examples of chart placeholders to serve as inspiration for your next data presentation.

All the chart templates you see in this article are part of our ‘Visual PowerPoint Graphs Pack’.
The templates combine the visual capabilities of PowerPoint with spreadsheet capabilities of Excel (embedded in PowerPoint) to create stunning results. To edit the charts, you just need to replace sample data with your own data in the embedded worksheet. The charts update themselves automatically.
![]()

Let us see some examples of creative chart placeholders:
Using product visuals as chart backdrop:
Let’s say you are a retailer of mobile phones and you want to show the sales performance of phone tablets in your shop for the past 6 months. Instead of using a boring column chart, you can use the screen of a tablet as chart backdrop. See the resulting Creative PowerPoint Chart:

Though the idea of using a tablet as a backdrop is simple, it is powerful enough to make your audience take notice of your slides.
You can use the technique for any product that has a screen or blank space. For example you can show sales performance of LCD monitors with the following chart:

Source: Chart Placeholders from Visual Graphs Pack
Blending your key points of discussion with chart backdrops:
Let’s say you are from marketing department of a large company and you want to make a presentation on the return on investment of your various marketing campaigns.
You can use the following template to show the returns from your mobile marketing campaign:
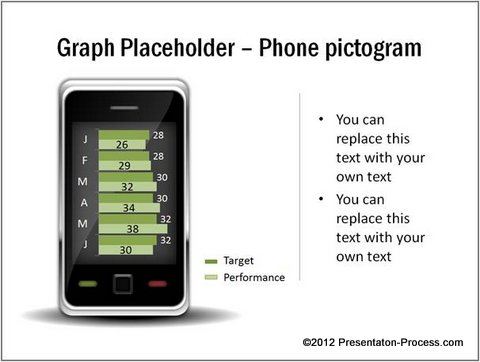
Related: Tutorial to create your own Phone Pictogram
The following can showcase the ROI from your web campaigns:

You can show ROI from your outdoor campaigns by using the visual of a hoarding as follows:
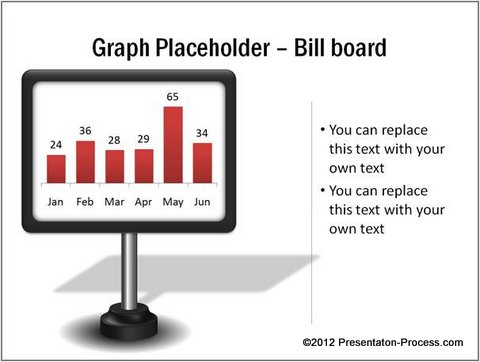
Source: Chart Placeholders from Visual Graphs Pack
Using placeholders to quote a chart from previous presentation/slide:
Let’s say you want to quote a chart you used in your previous presentation or slide to make a point. Instead of placing the old chart directly on your slide (which may confuse your audience), you can use the backdrop of a projector screen to quote the chart as follows:

You can stretch the idea of chart placeholders to any situation. The options are limited only by your imagination. But, before that, here are some…
Caveats:
While Creative PowerPoint chart placeholders can make your slides interesting, it helps to keep the following points in mind:
- Use placeholders sparingly. Use them for visual relief rather than as standard feature. Excessive use of placeholders can tire your audience
- Use placeholders only to show simple charts. Place more complex charts directly on your slides, to focus your audience attention
- Don’t let your placeholders hijack the show. A good placeholder can only help grab your audience attention. It is up to you to hold their attention with your insightful comments.
Useful PowerPoint Chart Option for business presenters:
It takes a lot of time and effort to create visually interesting chart placeholders. Most business presenters like you may not have the time to construct them from the scratch. That is why we came up with your ‘Visual PowerPoint Graphs Pack’. The pack has more than 320 business relevant, data driven PowerPoint graph templates that are super easy to use.
Take a look at this demo page to see how easy it is to create and edit great looking charts in no time using our pack.