
Part of : 320+ Visual PowerPoint Graphs Pack
Widest Variety of Data-Driven Graphs & Infographics for PowerPoint
Data-Driven Hand Drawn Min Max Column Chart

Description: A range of hand drawn style, scribble filled column charts, bar charts, pie charts and more to help you represent data in a friendly and fun way. Just replace the charts with your data, to customize it.
Arrow Style Conditional Charts with Negative Values clearly shown
 |
 |
Column Chart with Lowest Number highlighted

Clustered Columns Showing Product Performance

|
Sales & Profits Quarter wise – Dual Axis
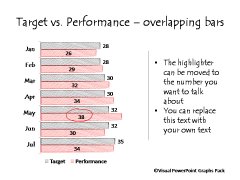
Bar charts Showing Target vs Performance
|
Target vs Performance in Columns
Bar Chart On Blackboard – scribble style
|


Related Templates from Graphs Pack:
|
|
|


Green Board with Column Chart

White Board with Pie Chart Showing Details

Scribble filled Editable Pie Charts

Price vs Profit % Bubble
Star Burst Bubble Chart
|

Stylish Column Graph
Conditional Arrows Chart
|


Hand Drawn World Map with Pie Call outs

NEXT STEPS:
Features | License Terms | Testimonials | Download Samples| Contact Us