Part of : 320+ Visual PowerPoint Graphs Pack
Widest Variety of Data-Driven Graphs & Infographics for PowerPoint
Data Driven Marketing or Sales Funnel with Details
 Description:
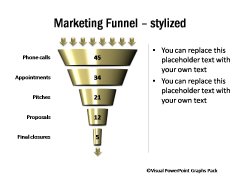
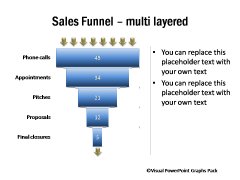
A sales funnel chart shows you stages in the sales process. For example, charts showing the number of phone calls needed to get certain number of appointments and how those appointments in turn convert into sales pitches, proposals sent and final closures. You can also use these chart for sales performance analysis and assess effectiveness of your marketing campaigns.
You can use the funnel and pyramid charts in sales / marketing presentations where the visual impact is important.
|
Marketing Funnel Stylized
|
Funnel with Layers
|
|
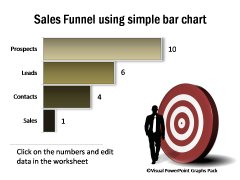
Sales Funnel as Bar chart
|
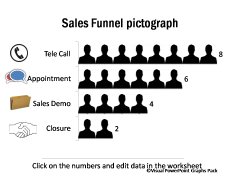
Data-Driven Pictograph
|
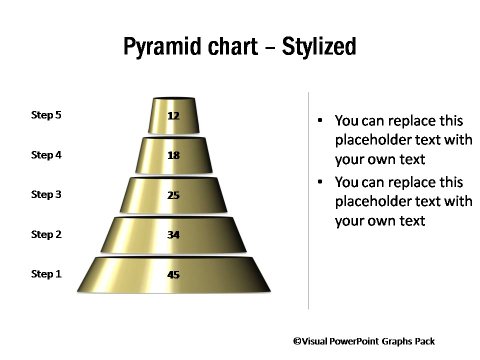
Editable Pyramid Chart Stylized
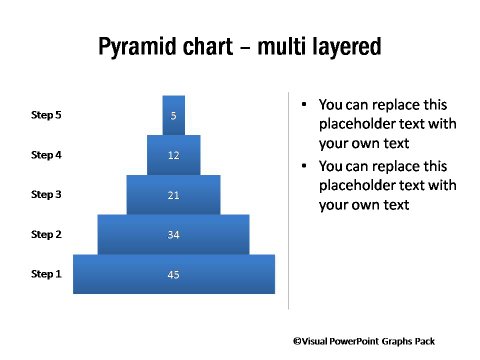
Multi-Layered Pyramid
Related Templates from Graphs Pack:
NEXT STEPS:
Features | License Terms | Testimonials | Download Samples| Contact Us
Return to Top of Marketing Funnel Charts Page

