Part of : 320+ Visual PowerPoint Graphs Pack
Widest Variety of Data-Driven Graphs & Infographics for PowerPoint
Bottles indicating % of completion

Description: Using a range of interesting infographics like bottles, jars, batteries etc. you can show the percentage completion of any activity. The fills can be adjusted by simply editing the data in the excel sheet attached to the chart.
|
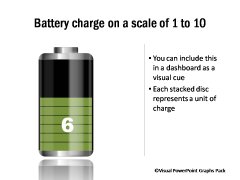
Battery Charge
|
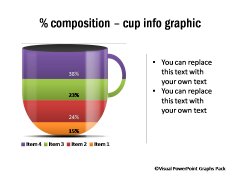
Level of Fill Percentage
|
Battery Meter with Data-Driven Percentage

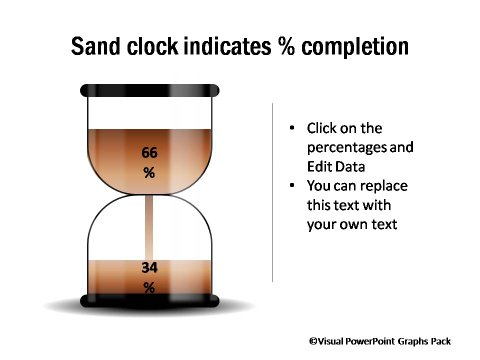
Sand Clock Showing Percentage Completion
Percentage Loaded in Truck – The Blocks are Driven by Data

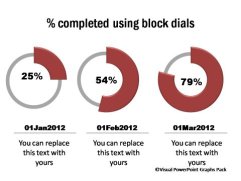
Filled Blocks Showing the Completed Percentage

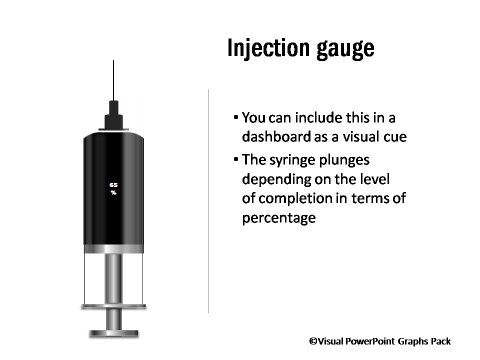
Injection Gauge Showing Percentage
Related Templates from Graphs Pack:
|
|

