PowerPoint Charts CEO Pack > Unique Diagrams> PowerPoint Balance
Part of PowerPoint Charts & Diagrams CEO Pack
Instantly download 750+ easily editable PowerPoint Diagrams for CEOs. Represent ANY business idea quickly & visually.
View scales and balance diagrams from CEO pack below:
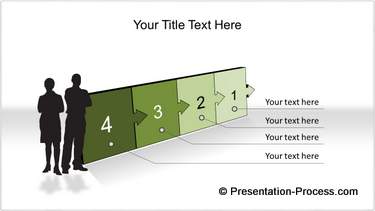
Stunning 3D PowerPoint Balance

Description:
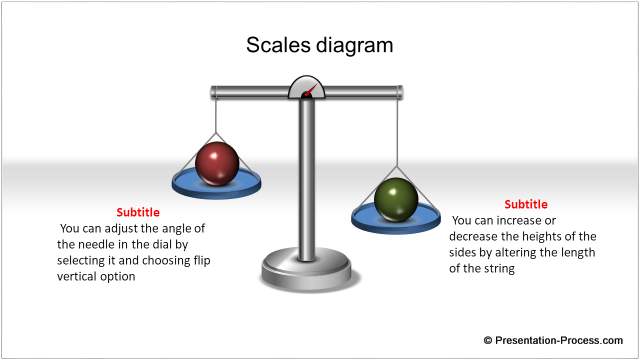
PowerPoint balance diagram template is used to convey concepts like evaluation of options, weighted arguments, weighing pros and cons, advantages and disadvantages, positives and negatives, deciding for and against etc. It is used in marketing, strategic and consulting presentations. Here are some popular concepts explained using the balance diagram: Work life balance, risk reward balance, comparing apples to oranges, time – money return etc. The scales diagram can be used to represent justice and law. The other keywords that indicate diagrams in set are: PowerPoint scales and Scales PowerPoint.
Variations of PowerPoint Scales Diagram

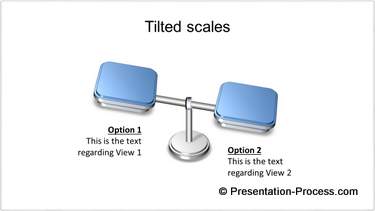
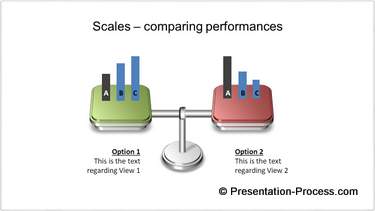
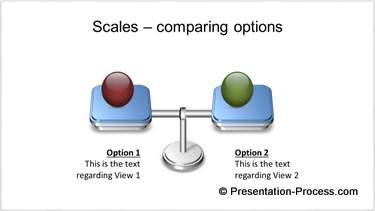
Tilted Scales Showing Comparison | Scales Comparing Charts
Balanced PowerPoint Scales
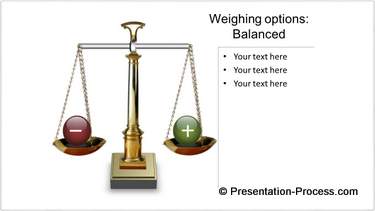
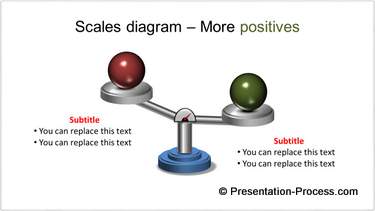
Positive and Negative PowerPoint Balance


PowerPoint Scales Diagram
RELATED DIAGRAMS IN THIS PACK