Part of : 320+ Visual PowerPoint Graphs Pack
Widest Variety of Data-Driven Graphs & Infographics for PowerPoint
Stylized Cluster Bar Chart Template for PowerPoint
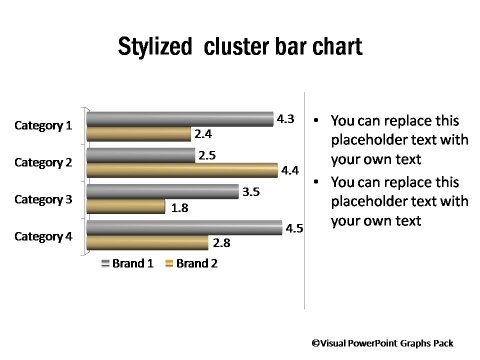
Description: Bar Graphs with a range of look and feel, 3D & 2D, 100% stacked as well as number based for use in your presentations. Even regular charts will now have insights and an element of uniqueness.
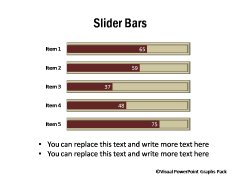
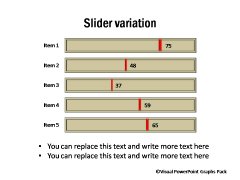
Slide Bars Showing Achievement against target
 |
 |
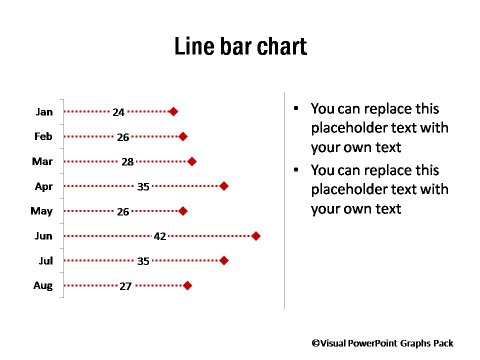
Dotted Line Style Bar Chart
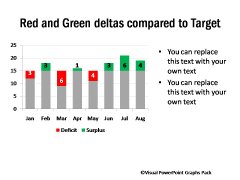
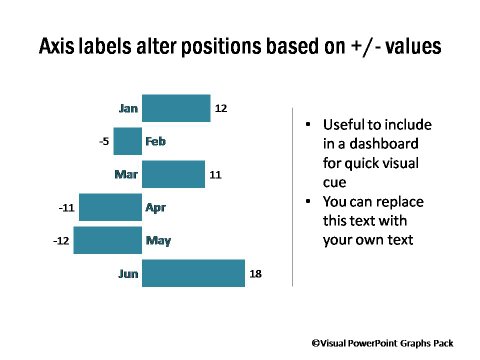
Conditional Chart for Positive Negative Values
|
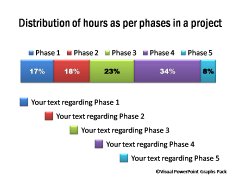
Single Bar Showing Series
|
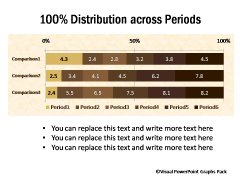
PowerPoint Bar Chart showing 100% Distribution
|

