Home > Presentation Examples > PowerPoint Diagram Example
See a presentation example of converting a boring table into simple and visual diagram. See the difference in clarity and effectiveness of the message.
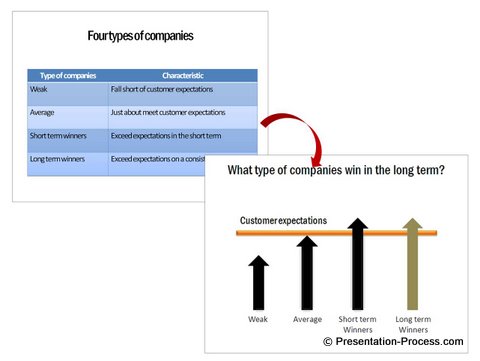
The text-based table we will convert into a visual PowerPoint Diagram today is:

The concerns with the text based table are:
- Though the information seems organized and structured, the real difference between the four types of companies is not brought out clearly by the tabulated text
- The table doesn’t help the audience to visualize the concept in the way it is intended by the presenter
- The content is not memorable
A complex PowerPoint table can be animated to help explain step-by-step. But such an animation does not solve all the issues identified above.
Let us convert the slide into a visual diagram.
Step 1: Isolate the core words

These are the only words that need to be there on the slide. The rest can move into the speaker notes.
Step 2: Plan the aspects to be visualized
The three aspects to be visualized are:
- A few companies meeting expectations and some exceeding them
- Changing customer expectations
- Long term winners exceeding expectations on a dynamic basis
Step 3: Visualize using an animated diagram
We can explain the concept using simple arrows and lines. We can capture the changes and movement using custom animation.
The title “Four types of companies” is not strong enough to generate curiosity in the audience. So, let’s change the title to ‘What type of companies win in the long term?‘ The slide answers this question beautifully. Here is how we present the idea…

Here is the transcript of the makeover from boring table to memorable PowerPoint Diagram:
(Click)
Companies can be divided into four types based on how well they respond to customer expectations.
(Click)
A lot of companies fall short of customer expectations and lose their way. We call them ‘Weak’ companies.
(Click)
Some companies just about meet customer expectations. They do average business and remain stagnant. We call them ‘Average’ companies
(Click)
The companies that win big business exceed customer expectations. However, not all those companies that win big business stay that way for a long time.
(Click)
The reason is – customer expectations keep rising all the time.
(Click)
It’s only those companies that match the growing demands of customers on a dynamic basis that win in the long term.
(Click)
So, for the question – “What makes companies win in the long term?” the answer is – “The ability to sense and respond to changing expectations of customers on a consistent basis seems to be the winning difference”
End of slide.
Point to note:
The key to converting a text-based slide into a visual diagram is to stop thinking like a ‘Document writer’ and start thinking like a ‘Movie director’. This change in approach will automatically make you visualize the way various objects interact with each other on the slide.
See the difference in impact when you create a visual PowerPoint Diagram:

Recommendation for creating diagrams in PowerPoint:
If you are used to developing slides in the traditional way, you may need help in visualizing your information. You need a structured way to identify the objects and relationship quickly and correctly.
In this example of transformation from table to diagram, the process for the makeover is just touched upon. There is a simple 3 step process to help you identify the objects and their relationships accurately. We teach this process in our workshops and the same process is also explained in our ebook – Visual presentations. When you understand and practice the simple process you can represent any concept as visual diagrams.
When your audience understands and remembers your message better, they make decisions quickly. When they take quick decisions your business grows fast.
Return to Top of PowerPoint Diagram Example Page
Return to Main Visual Presentation Examples Page
