
Home > Presentation of Data Page> Presenting Data Mistakes
Small mistakes are like bad breath. Your friends won’t point them out to you and neither can you find them out yourself. Find the small mistakes people make in a data presentation and learn how to avoid them.
Small mistakes in presenting data go unnoticed:
It is easy to correct big mistakes in your presentations, because they are easily noticeable. Small mistakes are difficult to identify, but they irritate the audience. Here are the 5 common mistakes made while presenting data and the ways to solve them.
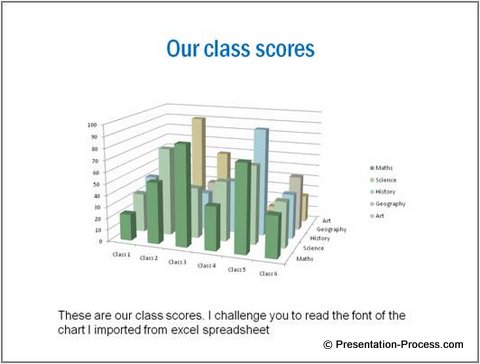
1. Retaining the small fonts of Excel in PowerPoint slides
Most presenters have the habit of sticking charts directly from excel sheet to PowerPoint. They don’t bother to increase the font size of the numbers (which is usually 10 when you stick a chart from excel sheet).
Want to know how hard it is to read that small font size from a distance?
Try reading the legend on the slide below:
Solution to issue with font size:
Increase the font size of text and numbers in the chart to at least 18 to 20. This is the minimum acceptable font size even in a small conference room.
2. Using images in chart background
Some presentation gurus advise putting pictures in the chart background for building an emotional connection with the audience. Here is the result:

Wow! That definitely strikes an emotional chord. But, where is the graph?
Remember, the fancy presentation methods used for presenting on culture and philosophy don’t work in business presentations. Remove all chart backgrounds. Let your audience understand your chart.
Related: 2 Creative Info graphic Examples
3. Flaunting thoroughness with footnotes
Some presenters boast the thoroughness of their research and the ‘correctness’ of their observation by using slides like this:

The disclaimers and footnotes occupy half the slide in font size 6. This immediately puts a distance between the presenter and the audience.
Solution to complex tables:
- Remove footnotes from your slides. Include them in your handouts if you must
- Don’t display raw data. Write your conclusions on your slides.
- Avoid using large tables on a slide. Table larger than 2X2 is quite difficult to follow on a slide during presentations.
4. Showing lack of sensitivity while writing text and digits
Some presenters don’t care about audience convenience while writing their text on slides. Here is a quick list of small mistakes and their solution:
- Don’t write vertical text on the Y axis or slanting text on the X axis. Your audience can’t read them easily. If you have a lot of text to write on the x- axis of your column chart, use bar chart instead.
- Don’t write large numbers like 56798745.08 on your charts or tables. Express the big numbers in Millions or Thousands. Round off the decimals while using big numbers. Use space between digits for easy reading. Ex: 12 000 or 12,000 is easy to read instead of 12000.
- Use wide intervals for your Y axis if you want to show gridlines. Avoid showing minor gridlines at all cost.
- Order your lists by groups or by alphabetical order for easy reference.
5. Showing lack of preparedness by reading numbers
A lot of presenters lose audience trust because they don’t familiarize themselves with the charts and numbers on their slides. They try to ‘figure out’ their charts along with the audience. They read the numbers from the slide instead of talking about what the numbers mean.
Solution to reading numbers when presenting data:
- Rehearse your charts at least 3 times before presenting them to the audience.
- Practice the custom animations used in your charts.
- Provide insights from the numbers.
Summary of small mistakes to avoid while presenting data:
- Retaining the small fonts of Excel in PowerPoint slides
- Using images in chart background
- Flaunting thoroughness with footnotes
- Showing lack of audience sensitivity while writing text and digits
- Showing lack of preparedness by reading numbers
Avoid these small mistakes and you will succeed in presenting data with purpose.
FRelated: Top 5 Presentation Design Mistakes
Return to Top of Presenting Data Mistakes Page