Part of : 320+ Visual PowerPoint Graphs Pack
Widest Variety of Data-Driven Graphs & Infographics for PowerPoint
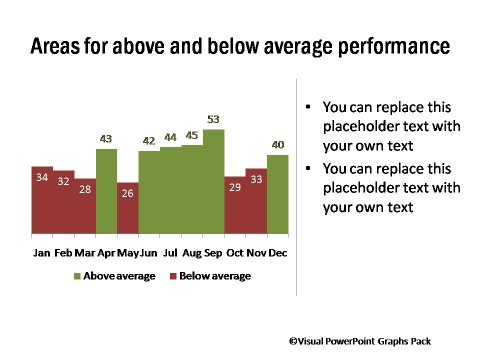
Chart Showing Total and Components
 Description: These performance charts show the total as well as components of any data. These charts are unique as you need to enter data only once in one worksheet for the totals and breakup to appear in the graphs. It is not possible to achieve this result with basic graph options in PowerPoint.
Totals and Breakup Details Shown in Chart

Totals are Displayed Automatically at the Top of each Column

Stylish Pie Chart Showing Break up of a Total

Related Templates from Graphs Pack:
|
|