
Home > Presentation Examples> Visual Diagram – Signal
Inspiration for diagrams can come from anywhere. Discover the amazing uses of a simple signal diagram in business presentations.
Visual diagram inspiration on the road:
Sometimes you get inspiration for diagrams from unexpected sources. Yesterday, as I was driving to my office I found inspiration to create a simple diagram using the visual of traffic signal.

First let us learn to create a signal diagram in PowerPoint.
1. Create the base
You can create the base for signal diagram by combining a rounded rectangle and a regular rectangle from auto shapes menu. Fill the shapes with black color to get the following result:

2. Draw the lights
Draw three circles that fit into the base you draw just now and color them Red, Amber and Green. They form the lights of traffic signal.

3. Switch ‘on’ the signals
You can’t have all three lights ‘on’ all the time.
To make a light glow:
Select a circular light -> go to shape effects -> Glow and add the biggest glow.

To dim a light:
Select a circular light ->Right click -> Format shape -> Fill ->Make the transparency as 50%

When you combine the two effects, you can create a set of signals as follows:
Once you have the signals ready, you can use them in multiple ways. Here are some application of the diagram in business presentations:
1. Task classification:
You can use the diagram to classify tasks into:
- Red = stop doing
- Amber= Maintain doing
- Green = Do more
You can create a diagram template to make the classification as follows:

Related: See how you can use icons to classify tasks
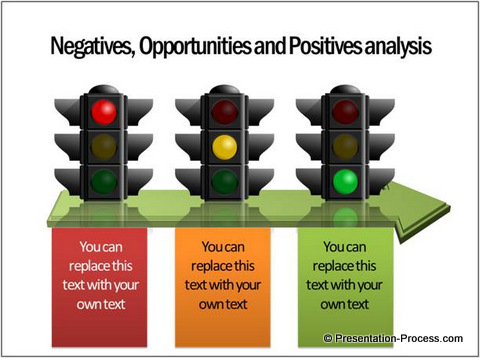
2. Negatives, Opportunities and Positives analysis
You can use signal diagram to evaluate a project based on Negatives, Opportunities and Positives. Take a look at the following diagram template to help you make the classification:
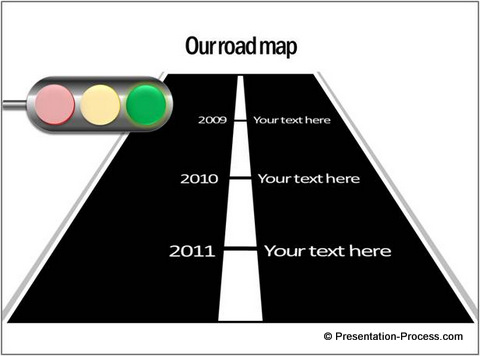
3. Explain your project roadmap
You can explain the journey of your project based on:
- Red = Factors that halted our progress
- Amber= Factors that didn’t affect us
- Green = Factors that helped us move forward
A diagram template for the purpose can be as follows:
So, you can draw inspiration from a lot of things around you to visually represent your business ideas.
Related: Concepts you can visualize with Everyday Phrases
Smarter option for business presenters:
If you don’t have the time to create diagrams from the scratch, we recommend you take a look at our CEO diagrams pack. The pack has more than 750 fully editable diagram templates to help you visualize every business idea imaginable.
Here are some samples from the pack:
Roadmaps & Timeline Options


Step by Step Project Phases with Completion Stickers


Transition over time | Construction Phases


You can see more roadmaps and concepts from the pack here >>
The pack of visual diagrams are super easy to use. Just copy our diagrams to your slides, edit them the way you want and replace sample text. Your professional presentation gets ready in minutes. It is a valuable resource for every business presenter who makes critical presentations.
Please browse through our diagrams collection and see how the pack can change the way you make business presentations forever.
Related: Using Visual Metaphor in PowerPoint
Related: Using Analogy to create Visual Presentations
Return to Top of Page Visual Diagram Idea – Signal