Home> 2007 & 2010 Tutorials > PowerPoint Models > Cluster Diagram
Learn to create the useful cluster model in PowerPoint. Discover creative variations of the diagram to convey your business message accurately and effectively.a
A quick word on cluster diagram:
A cluster model as the name suggests helps you visualize clusters of related ideas around a core concept. The diagram has a wide variety of applications – from capturing ideas in brainstorming sessions to capturing relationships in a computer network. The diagram is fairly easy to create.
A typical diagram looks as follows:

In this article, we will quickly learn how to create a simple cluster diagram and discover some creative variations of the diagram to visualize your ideas in business presentations. Let us learn to create the diagram step by step:
Step 1: Draw the Base Shape
Go to auto shapes menu. Using ‘Oval’ tool draw an elliptical shape as shown below:
 Right click on the shape -> Go to ‘Edit text’ and enter your text. Change the font color and size to suit your need. Place this ellipse in the centre of the slide.
Step 2: Create copies
Make copies of the ellipse you just created and place them around the center piece as shown below:
 Click on the shapes and change the shape fill to ‘No fill’. Change the line color of the ellipses to differentiate the clusters.
Step 3: Connect the clusters
Using the line tool connect the shapes to center piece. Alter the line color to match the line color of the ellipses as follows:
 You can click on the shapes, go to ‘Shape effects’ tab and apply a preset of your choice as follows:
 Your cluster model is ready.
Related: Create Eye catching PowerPoint Spiral Model
Let us see some creative variations of the diagram and their applications. The diagram templates you are about to see are taken from our CEO Pack Volume 2.
Points around the core
Take a look at the following cluster diagram template:

Source: Cluster Models from CEO Pack Vol. 2
You can use the diagram as a menu slide to give an overview of the topics you are about to cover in your presentation. The diagram can also serve as a ‘blown up version’ of one of the clusters from a larger cluster diagram you might have shown in your earlier slide.
Two Thought Groups
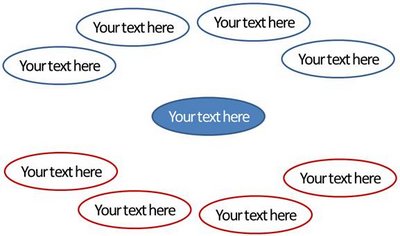
Here is a diagram template that shows two thought clusters:
 Try your own shape variations to make your diagram stand out.
Playing with Layouts
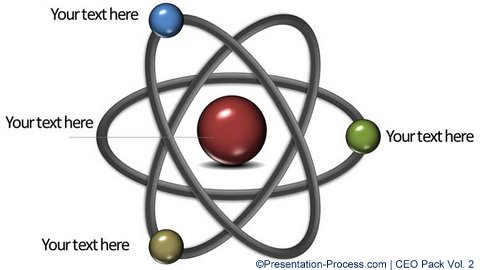
You can break the convention to capture the relationship between ideas in a far more accurate way. For example, the following cluster diagram uses the metaphor of a galaxy to capture the relationship between ideas:

Showing Multilevel clusters
You can draw diagrams that capture relationships across multiple levels as shown in the following network diagram:

Source: Cluster Models from PowerPoint CEO Pack Vol. 2
The variations you can come up with are limited only by your imagination.
Smarter option for business presenters:
While good diagrams help you convey your business message effectively, they are not easy to create, especially when you are hard pressed for time. That is why we came up with our charts and diagrams template packs for CEOs.
In fact all the diagram templates you saw in this article were taken from our PowerPoint Concepts, Models & Graphics : CEO Pack Volume 2. The pack has more than 815 business concepts, models and graphics to help you convey your business message with impact.
 You just need to pick a diagram template and replace the sample text with your own text to create your business slide. It is that simple. You can also pick and stick diagrams from different templates to come up with your own variations. The templates pack can literally change the way you create your business presentations forever.
Please browse through the collection to see the proof.
Why waste time creating your diagrams from the scratch, when you have such an elegant solution available off the shelf?
Related: Tutorial to Create Visual Metaphors like Galaxy Model
