Home > Presentation Ideas > Presentation Graphics >Creative Graphics
Find five creative PowerPoint graphics to show the concept of contributing factors. Get inspired to come up with your own variations for business presentations.
Creative graphics for common business concepts:
It is not easy to visualize business concepts in a simple and effective way. It is even more challenging to come up with representations that are visually interesting as well. In this article, you will find some interesting ways to visualize the idea of ‘contributing factors’. See how each variant conveys slightly different context depending on the way the design elements are positioned.
1. Basic representation of the concept
Here is a simple way to represent the concept of ‘contributing factors’. The graphic shows three factors that lead to a certain result. The factors are represented by simple text boxes:
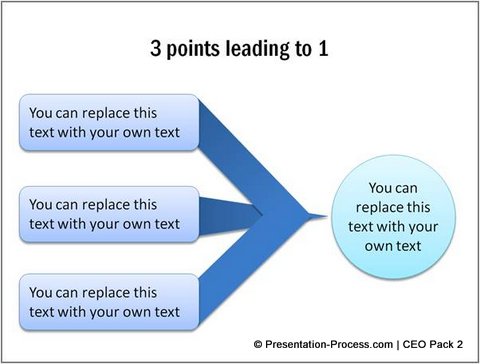 While the graphic serves the purpose, it doesn’t convey any deeper meanings than what is obvious. Let us see some variations that go beyond the obvious.
2. Factors pooling into a common cause
Take a look at the following diagram template:
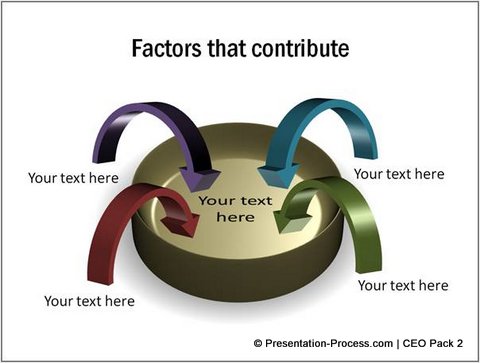 The direction of the 3D arrows conveys the concept of ‘pooling in’. Different colors of the arrows convey ‘different sources’ from which the factors originate.
3. Positive and Negative contributing factors
The following diagram template conveys the idea of ‘positive and negative factors’ contributing to a central cause. Positive factors are represented by green arrows and Negative factors are represented by red arrows:
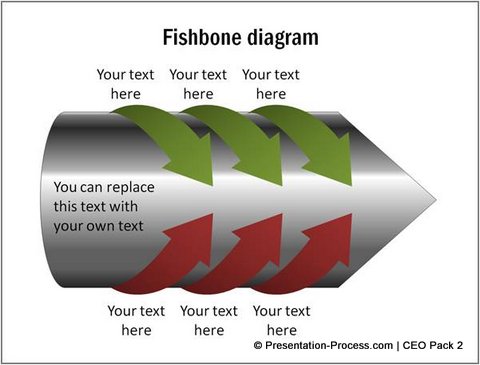
Source: Cause Effect Models from PowerPoint CEO Pack 2
4. Multistage contribution
The following diagram shows multistage contribution. In the first stage three factors contribute to the central cause and in the second stage the central cause contributes to the end result.
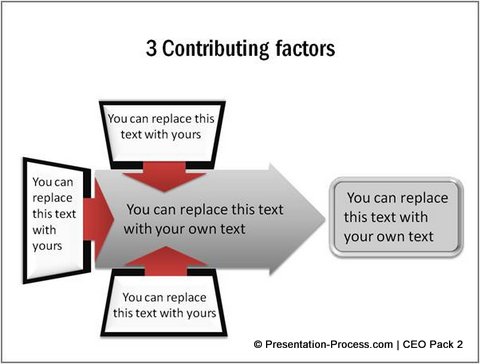 Here is a variation of the above diagram:
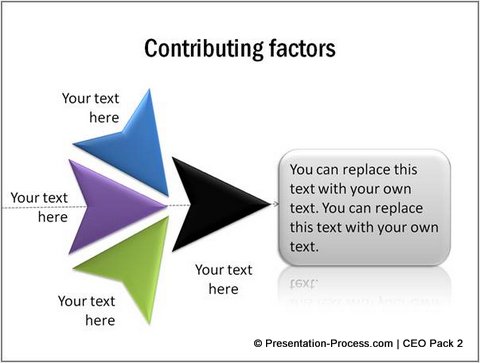 When you add custom animation in PowerPoint to such graphics, you will be able to explain each stage in detail.
5. Conceptual graphic
It is possible to convey some interesting concepts by using the design elements creatively. For example, see how the following graphic conveys the idea of various factors contributing to a bubble. The bubble could be ‘bloating stock price of a company’ or ‘unreasonable increase of real estate prices in a particular area’ etc.
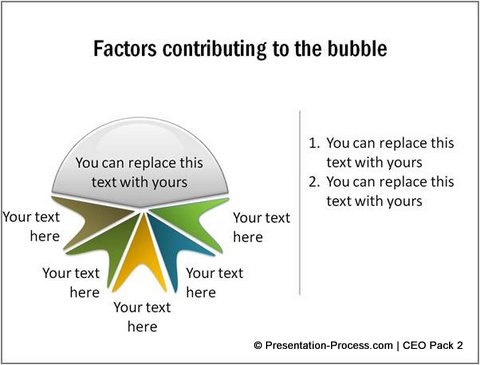 Thus, you can have so many variations for a concept as simple as ‘contributing factors’. It just requires a bit of imagination and creativity to capture the subtler messages.
Quality Graphic Resource
Good quality creative graphics have a way of grabbing and holding the attention of business audience. However, it takes a lot of time and effort to create professional quality graphics from scratch. If you are a busy business presenter who can’t afford the time to create such graphics yourself, we have an elegant solution for you.
We recommend you take a look at our ‘PowerPoint Graphics and Concepts Templates CEO Pack 2. The pack has 815+ premium charts, graphics and diagrams to help you visualize a range of business ideas.
You can browse through the concepts section of the pack here >>
Return to Presentation Graphics Page
