
Home > Presentation of Data Page> Creative Data Presentation
Throw away your excel sheets and PowerPoint files for your next data presentation. Engage your audience and capture their imagination using these 3 simple and creative ways to present data.
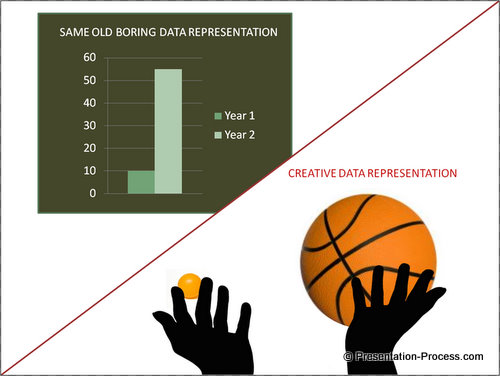
1. Make your data tangible for your audience:
We saw a marketing manager of sporting goods manufacturing company use this idea effectively. He threw a ping pong ball to the participants and said that the ball represented their market share in sporting goods segment. Then he threw a basket ball and said that it represented the market share of their main competitor.
If you looking to open your presentation with data, you can read more about it here.
How can you make your audience touch and feel the data in your next presentation?
2. Make people a part of your data presentation:
I saw a highly involving presentation made by the CEO of an NGO that supported orphans. The audience had people from various corporates and the presentation was to raise funds for the organization.
All through the presentation the presenter involved young children to represent data. For example, she invited 3 children to come up on stage and stand in a row. She asked the first one to sit down and the third one to raise hands. She said, “These children represent the growth of our NGO in the last three years. Our children are able to live better and reach higher because of your support. I want your help to make them reach higher next year “
This helped her not only to talk about her organization but also to strike an emotional chord with the audience.
How can you involve people in your next presentation?
3. Make the audience build your point:
In one of the budget meetings, I heard a senior manager employ this method effectively. While he allocated budgets to various departments based on their profitability, some department heads insisted on more budgets for their functions.
He invited everyone to do a small activity. He asked them to tear an A4 sheet paper in two halves. He then asked them to tear one of the halves in two. He took the small piece of paper to scoop some toffees from a jar on his table. He then used the bigger piece of paper to scoop toffees. Naturally, he could scoop more toffees with the bigger piece.
He finished by saying,” If the pieces of paper represent the share of profits brought in by a function and the toffee jar represents the funds we have. The goodies you get depend on the size of your sheet.”
He didn’t have to say anything else after that and the message was clear.
There are many ways to make your point using simple demonstrations, if you put your mind to it.
What can you come up with for your next presentation?

Rules for creative data presentation:
The activities you select need to follow these 2 critical rules to be successful:
- It should be made for a key point only. Such activities can be very powerful. So if you use it for an insignificant point, your audience will remember your presentation for the wrong reason.
- The conclusion should be clear to the last person in your audience. If it involves a long explanation to be understood, then avoid it.
Remember, a data presentation can be memorable or boring depending on the way you want to lend meaning to numbers. Take the time to make your audience relate to your numbers. It is worth the effort.
Related :More Creative Ideas for Presenting
Related Presentation : 3 Myths about Data Presentations