
Home > Presentation of Data Page> Hand Drawn Graph Effect
Create hand drawn effects for graphs in PowerPoint. Find simple tricks that create the illusion of hand drawn charts to make your data slides remarkable.
A quick word about Hand drawn graph effects:
PowerPoint doesn’t allow you to create hand drawn style images or graphs from the scratch. Even if you use ‘Artistic effects’ button in PowerPoint 2010 for your charts, the results are far from impressive.
Here is an example of ‘Line drawing’ effect on a simple column chart after it was converted into a picture:

You can use Paste Special option to create images out of charts. Read more about using Paste Special option here.
In this article, we will share with you some simple tricks in PowerPoint that will create the illusion of hand drawn graphs.
Three factors that create the illusion of hand drawn charts:
You can create the illusion of hand drawn charts by working on 3 simple elements. They are:
Chart background
Use chart backgrounds like black board, white board or note paper instead of the default backgrounds.
Fonts
When numbers in the axes and data labels are in hand written style fonts, the chart tends to look hand drawn.
Shape fill
When you use ‘No fill’ and thick outline, the chart looks like it is drawn with chalk or board marker. Let us see some examples that showcase the technique.

Note: All the chart templates in this article are taken from our ‘Visual PowerPoint Graphs Pack’. The pack has more than 320 business relevant data driven PowerPoint graph templates that are super easy to use.
You just need to replace sample data in the embedded worksheet of the charts. The pre-formatted charts get updated automatically. See the pack here

Creating Blackboard effect:
In the following example, we used the image of blackboard as background. The font used is Tempus Sans ITC. We used ‘No fill’ and thick outlines as mentioned earlier. Here is the blackboard effect chart:

Source: Hand Drawn Charts from Visual Graphs Pack
Green board effect:
Here is green board variation of the previous chart. You can use the blackboard in any situation to represent learning or teaching or classroom. The Green board can be used to represent school or as a an alternative to the blackboard. The green board effect graph:

In the following example, we used the image of white board as background. We used subtle visual cues like – board markers, duster and hand drawn call outs to add to the effect:

Related: Create blackboard background in PowerPoint
Note paper effect:
Instead of using ‘no fill’ you can use ‘scribble texture’ for filling your columns. Take a look at this Note Paper Style graph template for example:
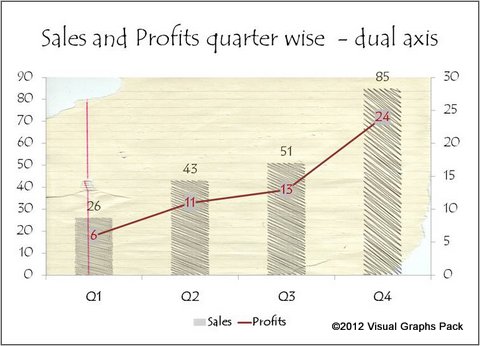
Using hand drawn background:
If you don’t want to use chart backgrounds like black boards or note papers, you can use any hand drawn image as slide background. Here we used a hand drawn world map as background:

Source: Hand Drawn Charts from Visual Graphs Pack
Thus, you can create some remarkable hand drawn data slides by following the simple tricks shown in this article.
A smarter option for business presenters:
Creating elegant and memorable data charts takes time and effort. However, many business presenters are too busy to spend their time designing elegant slides. That is why we came up with our Visual PowerPoint graphs pack.
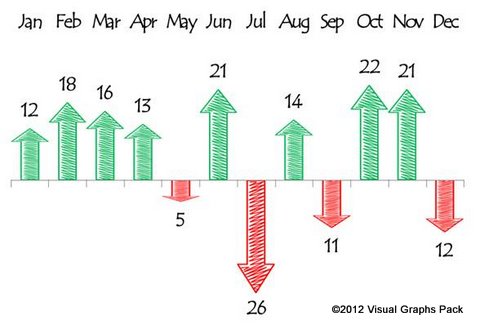
Now, you can create stunning data driven PowerPoint charts in no time. Instead of creating just the illusion of hand drawn charts, you can use more authentic hand drawn style charts that even use conditional formatting as follows:
The chart templates in the pack are very easy to use. Please take a look at this demo page to see how quickly you can create designer charts that make your audience sit up and take notice.
Why waste time constructing your charts from the scratch, when you have such an elegant solution available off the shelf?