
Home > Presentation of Data Page>PowerPoint Chart ideas
Here are some interesting ideas to show surplus and deficit over target values over time in PowerPoint. Get inspired by practical chart examples and variations.
Why a chart to show surplus and deficit?
Most business presentations include a slide to show performance compared to target. A typical slide that shows the information would look as follows:
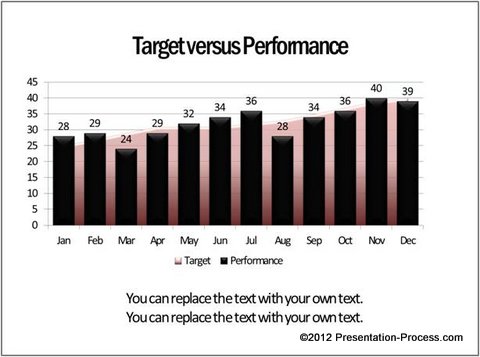 In such charts though audience can easily figure out the months that have underperformed and the months that did well, they can’t figure out the exact surplus and deficit values. That is where charts that show surplus and deficits come in handy. Let us explore some PowerPoint chart ideas to depict the information….
Show just the relative performance:
The simplest way to depict surplus and deficit is to make a chart that depicts just the relative values of performance compared to target. For example, take a look at the following chart template:

Source: Surplus Deficit Charts from Visual Graphs Pack
Audience not only knows the good and bad months but also the extent to which they are good or bad. An aesthetic variation of the above chart could be:

These chart types are especially useful to capture relative performances over a long period of time.
Related: Creative Performance with Speedometer Charts
Show absolute and relative values:
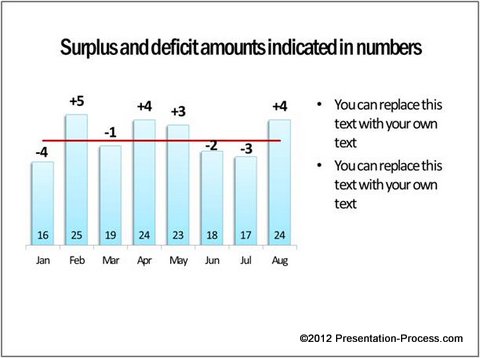
Instead of just showing the relative values like in the previous example, we can show absolute values too. Here is an interesting PowerPoint Chart Idea:
Source: Surplus Deficit Charts from Visual Graphs Pack
Data labels for each column at the inside base show performance values. The red line indicates target. The data labels above the columns indicate surplus or deficit. The chart template is formatted in such a way that all the numbers show automatically with the right signs (whether + or -).
A variation of the above chart is:

The chart is inspired by the structure of a DNA. The chart is completely uncluttered and visually appealing. Naturally such charts make your audience sit up and listen.
Applying conditional formatting to show the difference:

The above chart template not shows the relative values compared to target but also shows surpluses in green color and deficits in red color. It is much easier for the audience to get the message in one quick glance.
Sometimes the target values may vary each month instead of being fixed for the entire year. The following chart template takes care of such situations too:

Related: The Magic of Conditional Charts in PowerPoint
Conclusion:
With a bit of imagination, you can come up with countless chart variations to convey relevant and accurate information in your business presentations. However, creating such insightful charts takes time and effort.
If you are a busy presenter who can’t afford to invest time in creating such involved charts, and yet want to make an impression on your audience with your data presentations – we have an elegant solution for you.
We recommend you take a look at our ‘Visual PowerPoint Graphs Pack’. The pack has more than 320 business relevant chart templates to suit every business need imaginable. In fact, all the chart templates you saw in this article are taken from the template pack. All charts are 100% data driven and are super easy to use.
To edit the chart templates – Right click on the chart and go to ‘Edit data’ option. A worksheet opens up. Replace the sample data with your own data. The chart updates itself automatically. You don’t even have to type the numbers. You can copy paste numbers from your excel file into the embedded worksheet. The preformatted template will take care of the rest.
Please take a look at the detailed gallery page to see more of these useful charts.
![]() Why waste your valuable time constructing your charts from the scratch when you have such a high quality solution available off the shelf?
Why waste your valuable time constructing your charts from the scratch when you have such a high quality solution available off the shelf?
Related: Target Vs Performance Chart Ideas