
Home > Presentation Ideas > Presentation Graphics > Relationship Diagram
Discover creative ideas to draw relationship models and diagrams in PowerPoint using Arc tool in auto shapes menu. Make your next business presentation remarkable.
About Relationship diagram in PowerPoint:
In business presentations you may often be needed to represent relationships between entities using diagrams. While most such diagrams are created using boxes and circles, we will explore some amazing uses of simple arc tool in auto shapes menu in PowerPoint to portray different kinds of relationships.
You will find the ‘Arc tool’ in Basic shapes section under Auto shapes menu.
 Once you have the basic arc, you can increase / decrease curvature using the yellow diamond handles. You can use the functions in the Shape Outline menu to create variations like these:
 There is a lot that can be achieved with the simple Arc tool.
The diagrams you are about to see are taken from our ‘CEO Pack – Volume 2’. The pack has more than 815 fully editable diagram templates in PowerPoint. The pack covers a wide range of business concepts, models and PowerPoint graphics for business users.
Let us explore the diagram templates now:
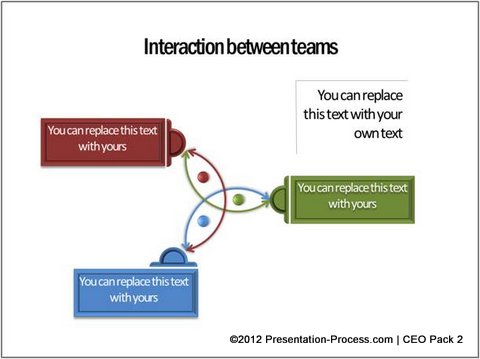
Interaction between teams
Take a look at this team interaction diagram template:

We used arc tool to represent interaction between three teams. Unlike a Venn, the diagram retains the attention on the teams rather than on the interaction. We added arrow tip to arcsto indicate the end points.
You can add arrow tips to both ends of the arcs to represent reciprocal relationship between teams as follows:
Source: Relationship Models from PowerPoint CEO Pack 2
Venn Diagram with a difference
The Arc tool allows you to represent interdependence between teams by varying the line colors. Take a look at the following diagram template for example:
 The play of colors makes the diagram visually interesting while keeping the message subtle. If you want to show the interdependence in an obvious way, you can go for the following relationship diagram variation:
 Related: Improve Venn diagram with Custom Animation
Interlocking Realationship
One of the biggest advantages of using an arc tool instead of a circle is – you can show interlocking relationships. For example, take a look at the following diagram template:

Source: Relationship Models from PowerPoint CEO Pack 2
The circular arrows seem to be interwoven. The colors indicate different processes or teams. Thus with a simple arc tool you can come up with interesting variations to show relationships between entities.
Found the article useful?
You will find a number of such useful PowerPoint tutorials in this site (probably the largest collection of diagram tutorials on the net) to help you visualize your business ideas. We urge you to explore the site fully to enhance your diagramming skills. If you find our site useful, please share the articles with your friends.
Smarter alternative for business users:
Creating diagrams in PowerPoint is a time intensive process. Unfortunately you may not always get the time to create such beautiful diagrams from the scratch, every time you want to make business presentations. That is why we came up with our ‘CEO PowerPoint Diagram Templates Packs’. The two packs have more than 1600 unique PowerPoint Charts, Diagrams, Graphs and Graphics to help you visualize every business concept imaginable. In fact, all the diagram templates you saw in this article were taken from the pack.
The templates are surprisingly easy to use. Choose your diagram template from the CEO pack – replace sample text with your own text and your professional business slide gets ready in no time. It is that simple. Why waste your valuable time building your diagrams from the scratch, when you have such a high quality solution available off the shelf?
Please browse through our Business Diagrams Section of CEO Pack 2 to see how you can change the way you create your business presentations forever.
Related: 5 Creative Powerpoint Tree Diagrams