
Part of : 320+ Visual PowerPoint Graphs Pack
Widest Variety of Data-Driven Graphs & Infographics for PowerPoint
Infograph showing Percentage break up of Shopping

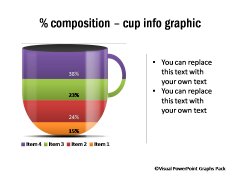
Description: Different infographics like Bin, Bottles, house, coffee cup etc. can be used as metaphors to show the percentage breakup. Use the infographic most suited to your presentation and edit the data to customize.
|
Battery Chart Showing %
|
Data-driven easy to edit Bottle Infographic
|


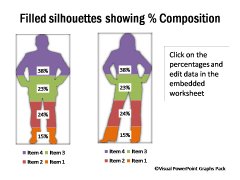
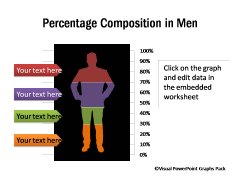
Percentage Break up across Men and Women: 2 Alternatives
 |
 |
More Alternatives for Percentage Composition
 |
 |
|
Stylish Coffee Cup Infographic
|
Share of Shopping Cart
|

Dials Showing Distribution of Views/ Performance
 |
 |
|
Savings Break Up Chart
% Composition Across Country
|
Budget break up graph
Break up of Household Expenses
|


Bin Infographic Showing Composition

Related Templates from Graphs Pack:
|
|
|

