It Is Easy To Make Your Finance, Report, Budgeting, MIS Or Any Data Presentation Exciting & Insightful With…
Visual PowerPoint Graphs Pack : 100% Data-Driven Templates
Instantly download 320+ fully data-driven PowerPoint Charts to makeover data-slides in minutes!
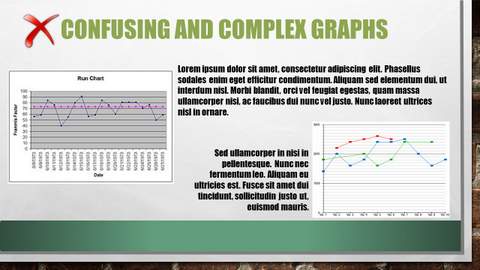
Still Stuck With These ‘Old’ Style Data-Charts?
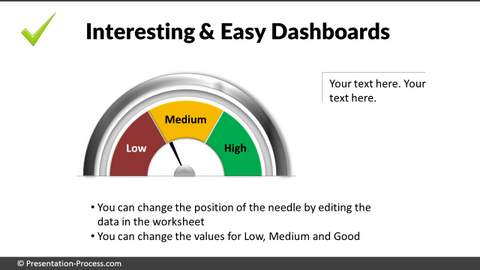
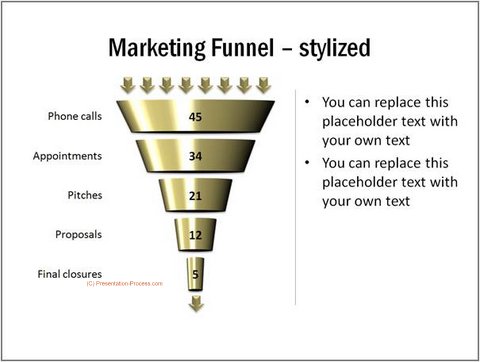
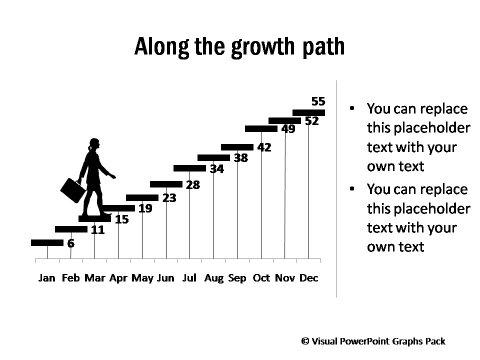
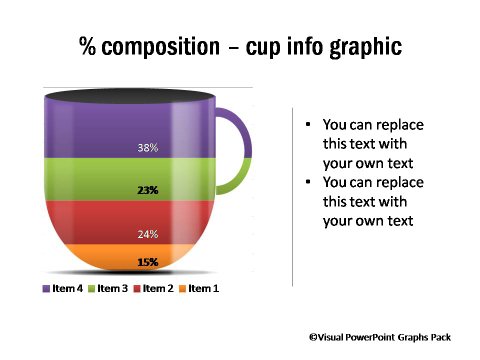
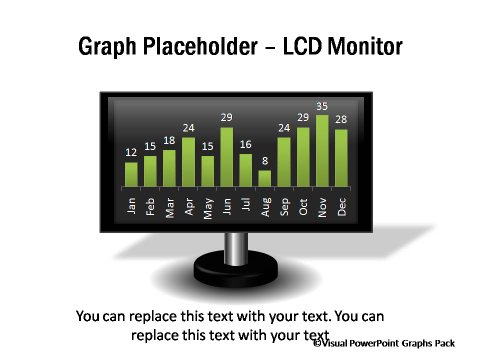
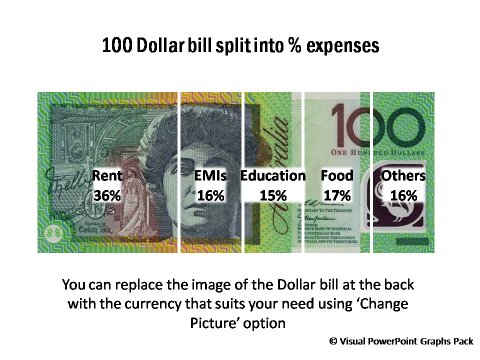
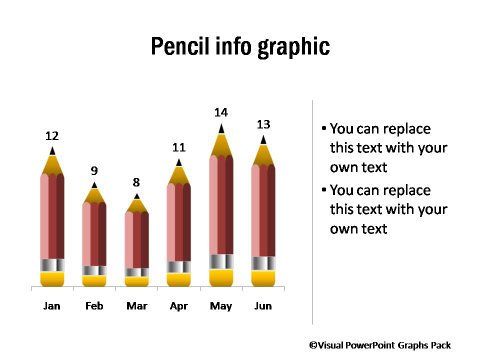
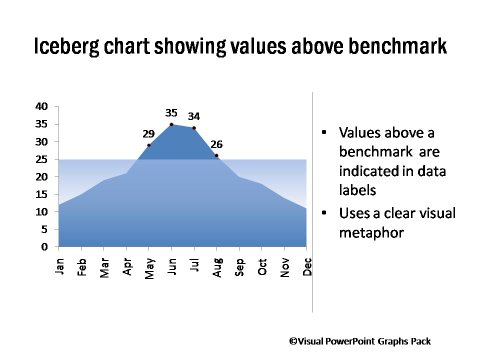
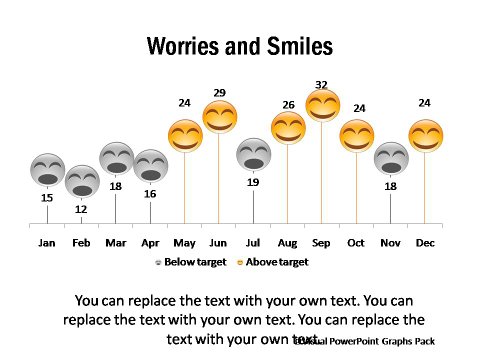
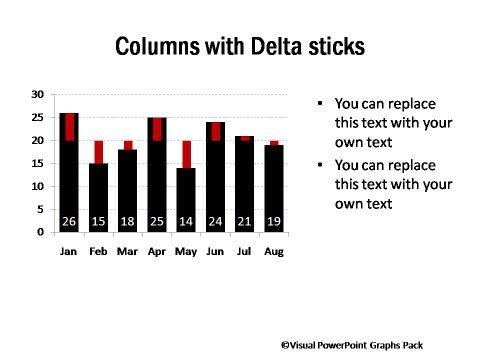
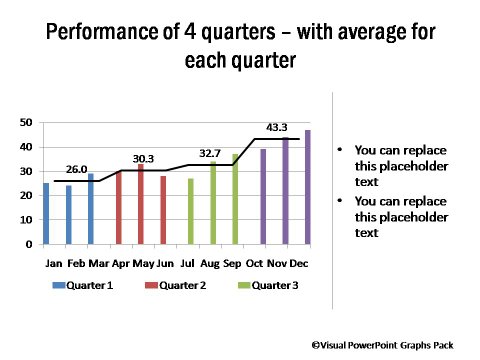
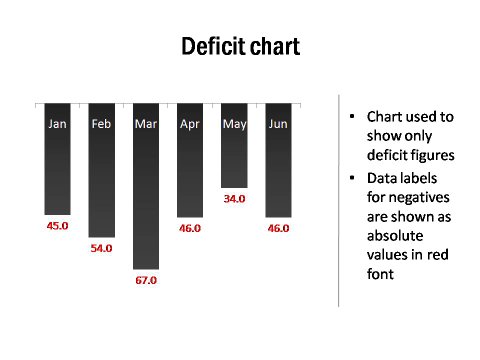
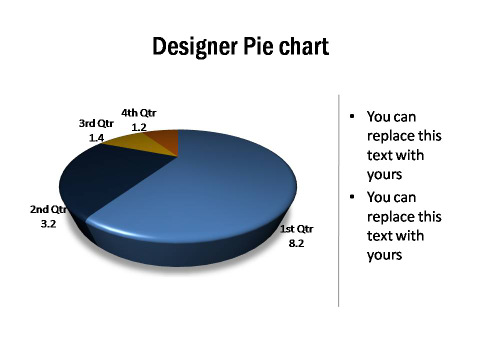
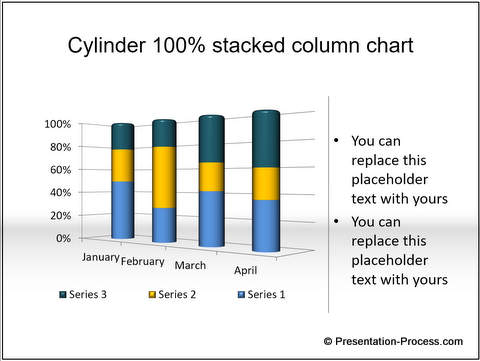
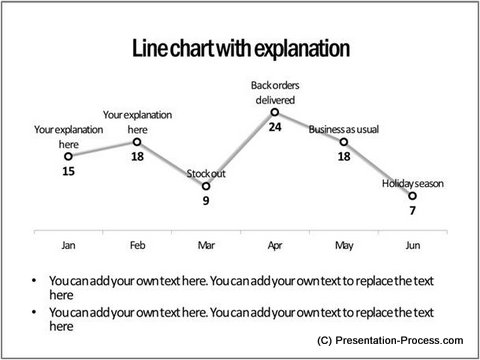
Now You Can Impress Your Audience With Charts Like This…
Click to view data-driven templates showcase below :
Fully Compatible with PowerPoint on PC & Mac. Available in Standard 4:3 & Widescreen 16:9 Sizes.
Browse Data-driven Templates in Visual Graphs Pack
Get all these templates and more in the Visual PowerPoint Graphs Pack
Presenting Data Driven Slides Aren’t Easy
Data is powerful. It is the most convincing way to support your logic and showcase your performance. But it also has the power to wreck your presentation.
PowerPoint is not Excel
Some of the biggest mess-ups in data presentations are usually done by those who know too much of Excel. There is a HUGE difference between creating data presentations in PowerPoint and sharing data reports in Excel. Unfortunately most business presenters are not aware of the difference and hence usually create their PowerPoint slides, by ‘copy- pasting’ their complex and elaborate charts from Excel.
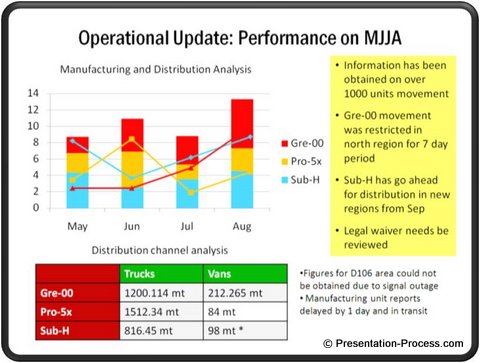
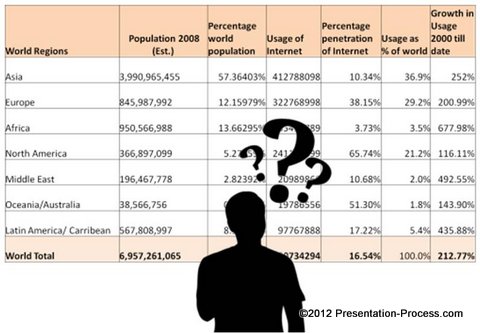
Excel-Style Slides Are Confusing
When presenters try to share complex data-slides, audience either switch off or start spending time trying to make sense of the data. Either way, as a presenter – you get sidelined. You lose your audience at a critical juncture of your presentation.
Data Need To Be Visual & Easy To Understand
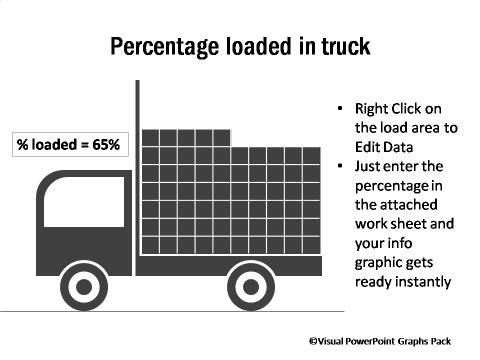
n a boardroom you need to present your charts for quick understanding, not for in-depth analysis. One of the most effective ways to make your audience engage and understand complex data is to use Infographics. That is, represent your data visually – in a clear and fun way. Use easy to remember metaphors.

Creating Charts for Presentations Takes Time
Most presenters spend hours & days putting together their presentation content. They are usually running against a deadline. It takes a lot of time and effort to visualize creative ways to present your ideas & design the graphs. This doesn’t even include the time to learn all the hidden PowerPoint tools.
With Visual PowerPoint Graphs Pack You Have A Super Easy Way to Create Infographic Style Slides and to make Data Presentations Simple and Engaging for your audience. ..

When you present your data the right way...
- Your budget presentation will get get the nod of approval it deserves
- Your finance report will make your audience take the action you recommend
- Your performance report will impress your higher-ups (and your team will thank you for it
- …and potential clients will trust you and your company more.
The irony is – it is quick and easy to create complex and intimidating charts and slap them on your slides.
It takes a lot of imagination, creativity and time to create simple and insightful charts in PowerPoint.
We realize that you are a busy presenter – and time is at a premium for you. At the same time, you can’t compromise on the look and feel of your charts for your key presentations.
That is why we recommend you take a look at this unique solution for Ready To Use Data-Driven Graphs for PowerPoint: 320+ Visual PowerPoint Graphs Pack
How Easy Is It To Use Templates from The Visual PowerPoint Graphs Pack?
Watch short video below to know:
Download these uniquely creative data-driven templates and start making over your data presentations right away…
How does the Visual Graphs Pack compare?
Features Comparison
Advanced Conditional Charts:
Data-Driven Infographics
Number of Chart Categories:
Type of Effects applied to charts:
Templates designed by:
Support in using templates:
Other Template Providers
None.
Editable infographics only
5 / 6 Basic options
Basic
3rd Party Designers
None.
Visual Graphs Pack
Extensive Conditional Charts Included
Speedometers, Funnels, etc. included.
40+ Categories Included
Advanced Gradients, 3D & Charting
Created 100% In-house by Owners
Extensive step-by-step video tutorials
You Won’t Find Such an Extensive Collection of Advanced Data-Driven PowerPoint Charts ANYWHERE Else.
Download Visual PowerPoint Graphs Pack Now & Get 2 Bonuses Valued at $120!
Get 320+ Data-Driven PowerPoint templates to make your Finance, Report, Budgeting, MIS Or Any Data Presentation Exciting & Insightful !
Download today & get $50 OFF
One-Time Price: $199 249
Get Download details immediately after purchase | 30 Day Money Back Guarantee
Fully Compatible with PowerPoint on PC & Mac. Available in Standard 4:3 & Widescreen 16:9 Sizes.

30 Day Money-Back Guarantee
If my product doesn’t make a measurable difference to your presentations, you can write to us within 30 days of purchase, and we’ll refund 100% of your money. No questions asked.
After all, if you are not happy with our product, we don’t deserve your money. It’s that simple.

Next Steps
Complete Checkout & View Transaction Success page
Get Email with Login Details. Download your files.
Start making over any business presentation!
Business Presenters Using the Visual Graphs Pack Include…

Who am I to create these templates?
An experienced business presenter ...

My name is Ramgopal. With me is Arte, my wife & business partner.
We both have been trainers and are committed to helping training course creators like you create better presentations.
We both held very senior positions in the corporate world. I worked as Senior Vice President in HSBC - a multinational Bank. During my corporate career, I have delivered every kind of business presentation - sales, budget, company introduction & executive presentations. I have developed training content, delivered training programs and managed a team of trainers.
Arte worked as Head Product Development and Requirement Analysis in i-flex Solutions (now part of Oracle Financial Solutions). She was involved in core product training and pre-sales presentations in her company.
In 2008, we founded Metamorph Training Pvt. Ltd. - a company that trained senior executives and training professionals on Presentation Design.
Today, we own multiple sites :
Presentation-Process.com

All-PPT-Templates.com

PrezoTraining.com

All these sites are dedicated to helping trainers and business presenters make remarkable presentations.
We spent years learning instructional design, neuroscience and behavioral psychology.
So, it is fair to say - we understand the challenges of business presenters.
Our work has featured on

Frequently Asked Questions
Will it work on my computer?
Are there any watermarks in the slides?
Help! I have an issue with checkout
Can I download and test some samples?
What are the License Terms?
Do these templates work with Excel?
Can I Use This both on My Laptop and PC?
How can I find a specific chart or diagram?
P.S. Go ahead and get the pack. After all, there is really nothing to lose with our Ironclad 30 day Money back Guarantee....
....and everything to gain by downloading today!!
I’ll see you on the inside.
*Disclaimer* Individual results will vary from person to person. We cannot guarantee any results with the help of our training and templates. All the products and services are provided for educational and information purposes only. The testimonials on this page are experiences of our customers and you cannot assume that you will get the same results.


