Part of : 320+ Visual PowerPoint Graphs Pack
Widest Variety of Data-Driven Graphs & Infographics for PowerPoint
Bullet Charts – Vertical with Percentages
 Description: Bullet graphs – unlike Gauges and meters – display a lot of information in very little space. You can use them wherever you want to use meters and gauges.Simply enter your data to create vertical or horizontal charts with percentages or numbers.
Designer Chart with Number Values

Designer Bullet Graph with Number Values

Horizontal Chart with Percentages – Bullet

Multiple Bullets in Chart

Related Templates from Graphs Pack:
|
Marketing Funnel & Pyramid
|
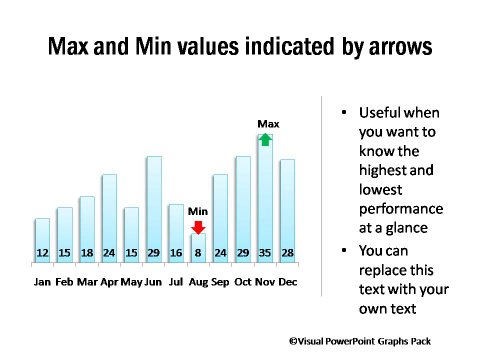
Conditional Chart showing Min Max Values
|