
Part of : 320+ Visual PowerPoint Graphs Pack
Widest Variety of Data-Driven Graphs & Infographics for PowerPoint
Data-Driven Speedometer with Completion Percentage
 Description: Use the speedometer in dashboards to and to give a quick context of your performance and provide top level details.It is useful in project, HR and other presentations that are about reporting. They are colorful, easy to understand and easy to enter data and customize to your situation.
|
Opposite Projections
Speedometer showing qualitative parameters
|
Balanced Scorecard
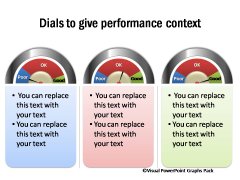
3 Different Dials for Comparing Performance
|


Gauge Chart Showing Percent Completion

Speedometer Showing Low High Medium Performance

Related Templates from Graphs Pack:
|
|
|

