Part of : 320+ Visual PowerPoint Graphs Pack
Widest Variety of Data-Driven Graphs & Infographics for PowerPoint
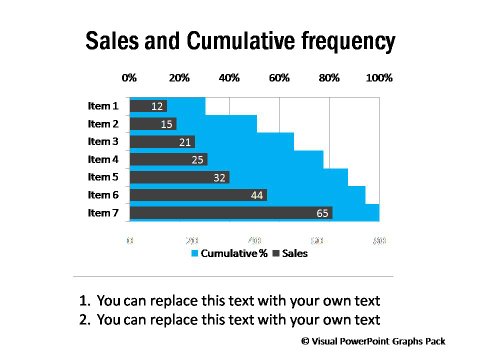
Step Chart showing Sales and Cumulative Frequency

Description: This kind of chart showing stages of change is useful in any presentation or report related to performance update. It shows the declining or upward trends in targets, achievements etc. visually.
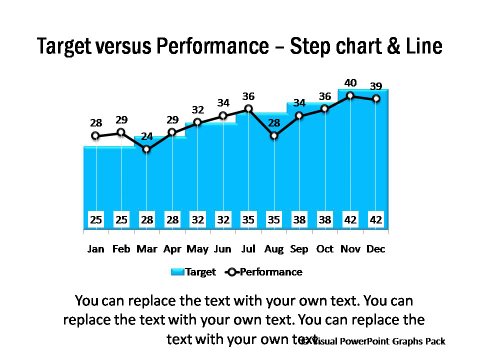
Multiple Charts Combination showing Target & Performance

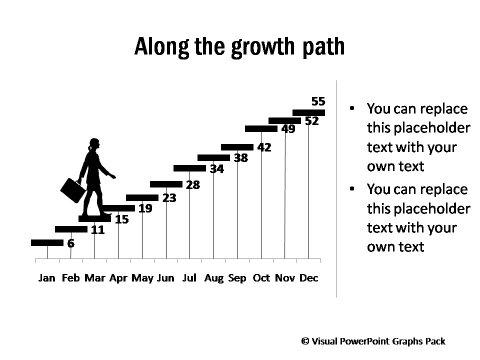
Graph Showing Growth Path useful for HR & Sales

Graph Showing Declining Performance


