Part of : 320+ Visual PowerPoint Graphs Pack
Widest Variety of Data-Driven Graphs & Infographics for PowerPoint
Project Performance and Backlog Chart
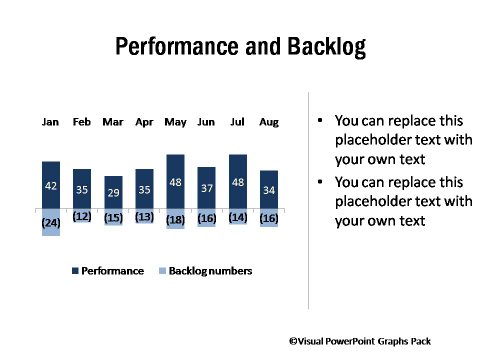
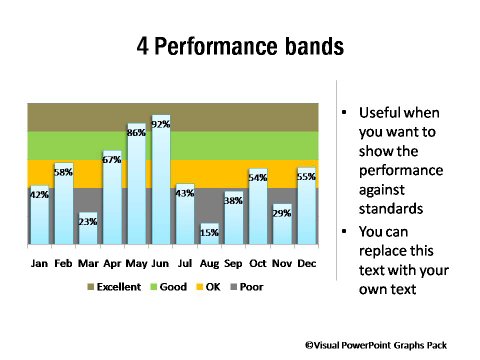
Description: Project Management Reporting requires a range of graphs representing information like control charts, cumulative achievement till date, burn down charts and more.
This collection provides pre-formatted PowerPoint charts where you just need to enter your data.
Burn Down Chart Showing Completion Rate

Cumulative Achievement vs Cumulative Target
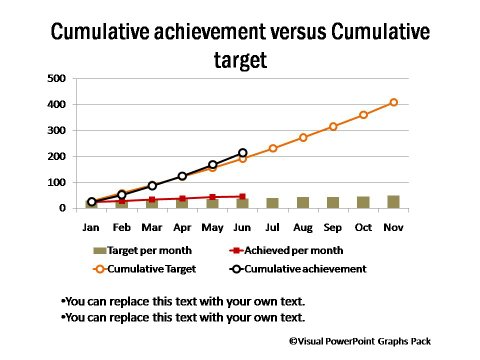
Project Target Revised as Per Achievement

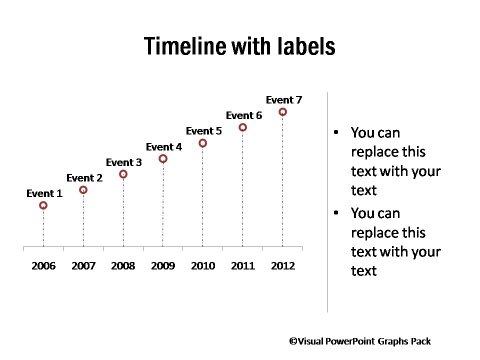
Project Timeline with Labels
Control Chart with Standard Deviation

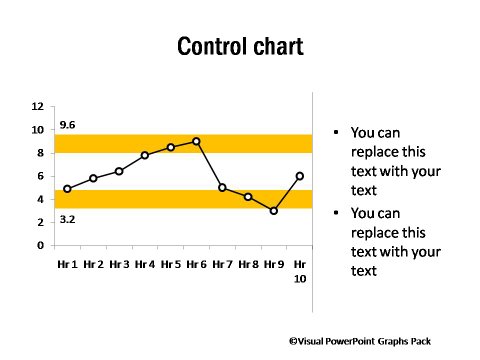
Control Chart with Upper and Lower Tolerance
