Home > PowerPoint Tutorials > PowerPoint Pie Chart
Spice up your PowerPoint Chart with this simple yet remarkable technique of adding a frame. Follow our step by step instruction to take your pie charts to the next level. This tutorial has been updated with step by step video on creating the pie chart.
The designer pie chart you’ll learn to create today is:

Where to use Designer Pie Charts?
Such well-formatted and professional charts are extremely useful in marketing presentations, where you want your slides to look attractive and attention grabbing.
If you have any experience in presenting data oriented slides to restless audience, you know that ‘usual’ charts can put your audience to sleep. This article shows you a simple way to makeover your ‘usual’ pie charts in a step by step way.
Watch Video Tutorial Below
Or follow the step by step process outlined below:
Step 1: Create your basic PowerPoint Pie Chart
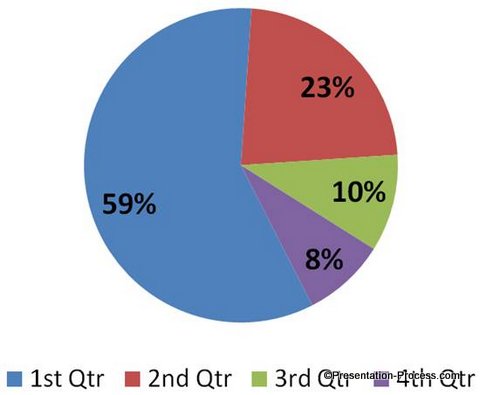
The first step is to get your basic pie chart in place. So, select your data and create your simple 2D pie chart. Here is a simple pie chart we created with the standard sample data:
Step 2: Create the background frame
The next step is to create the background frame to house this pie chart.
Go to Auto shapes menu. Select the ‘oval’ tool and draw a perfect circle while holding the ‘Shift’ tab.
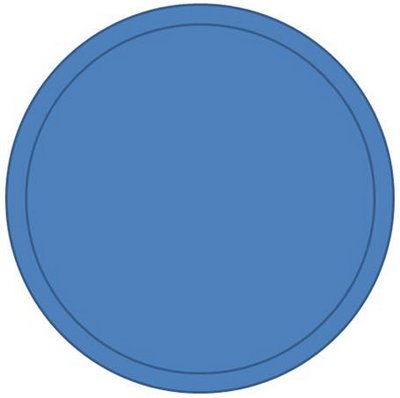
Make a copy of this circle. Right click and choose ‘Size and Position’. Select ‘Lock Aspect Ratio’ and resize the copied circle to 90%.

Place the smaller circle at the center of the larger circle as follows:
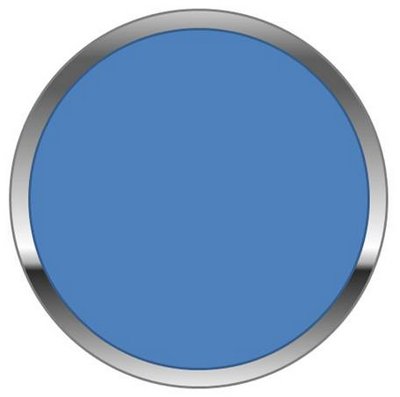
The next step is to add that metallic gradient to the outer frame. For this, select the outer circle, Right click and go to ‘Format shape’ option.

Choose ‘Fill’ -> Gradient fill -> Preset colors -> Chrome II. Let the outline color be dark grey by going to Line Color> Solid Line and selecting one of the dark grey shades.
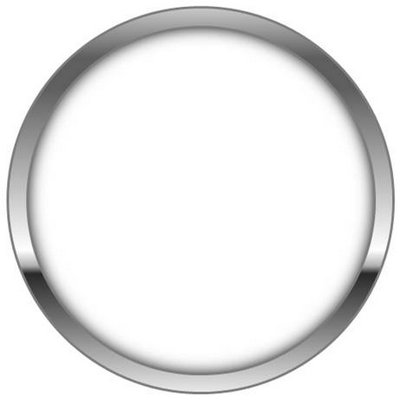
Select the inner circle, fill ‘white’ color, make the outline ‘Dark grey’ and add inner shadow as follows:

Right click on the smaller circle. Go to ‘Format Shape’ -> Shadow -> Presets -> Inner -> Inside Center. Increase the size of the blur to 19pt. The result will be as follows:
Related: Create Beautiful Frame for Picture
Step 3: Position the frame behind the pie chart
The last step is to group the two circles using ‘Ctrl + G’ option, copy and paste them behind the pie chart using ‘Send to Back’ option.
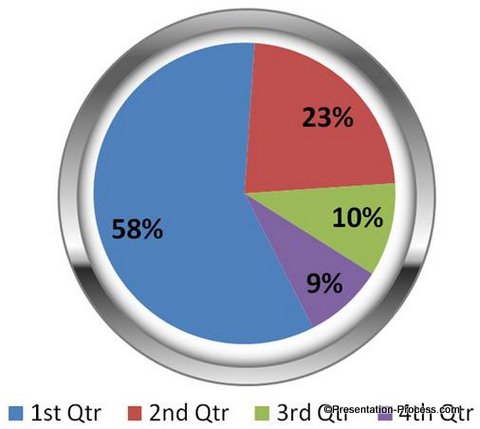
When you add gloss and shadow to the pie chart you will get the final result as follows:

As shown above, you can choose to move the legends to the top, to allow space for shadow. This designer PowerPoint Pie chart is bound to make your audience take notice of your slides.
Related: Learn to create Glossy Effect
More options for eye catching PowerPoint Graphs:
We wish to show you some more interesting PowerPoint graph options. The graph templates are part of our ‘750+ PowerPoint Charts and Graphs templates Pack for CEOs’.
Pie Chart with Gold Frame | PowerPoint CEO Pack

3D PowerPoint Pie Chart created from CEO Pack

Stylish Drill Down Pie Chart from CEO Pack

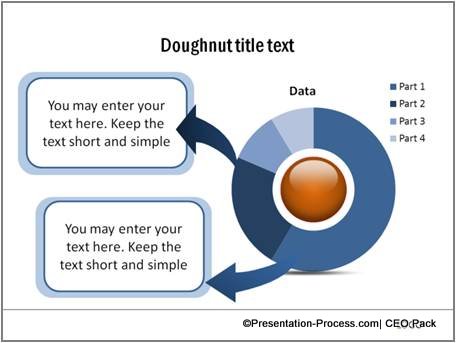
PowerPoint Doughtnut Chart from CEO Pack
Related:See Bar Graphs Section in the PowerPoint CEO Pack
The pack has a lot of data driven and editable chart templates to help you create professional slides in minutes. Just copy our pre-designed data driven charts to your slides and replace the sample data with your specific data set.
It is probably the quickest way to create professional charts without spending hours trying to enhance their look and feel.
If you are a business presenter responsible for creating critical presentations, the CEO pack is a worthy investment. Please browse through our ‘huge diagram templates collection’ and discover a whole new way of making a lasting impression on your audience.
Related: Using Charts in PowerPoint with Impact
Related:PowerPoint Chart Animation with a Twist
Return to Top of PowerPoint Pie chart Tutorial
