
Home> All PowerPoint Tutorials > PowerPoint Models > Harvey Balls PowerPoint
Learn to create Harvey Balls charts in PowerPoint. Follow our easy instructions to create these useful symbols for your project presentations.
Quick word about Harvey Balls in PowerPoint:
According to Wikipedia “Harvey Balls are round ideograms used for visual communication of qualitative information. They are commonly used in comparison tables to indicate the degree to which a particular item meets a particular criterion”.
Here is an example of a comparison table with Harvey Balls:

The small icons can be also be used to indicate percentage completion of different stages in a project. In this article, you will learn how to create these useful icons from scratch.
Watch Step by Step Video below on
How to Create Harvey Ball
Click to play
You can watch the video above or follow the article below to create your own project update diagram:
Step 1: Create the shapes
Go to auto shapes menu and pick the ‘Oval’ tool to create a perfect circle while holding the ‘Shift’ tab. Remove the shape fill.

Make a copy of the circle and go to ‘Format’ tab -> Edit Shape -> Change Shape -> Basic Shapes -> Pie Shape.

Now, align both the shapes vertically and horizontally to get the following result:

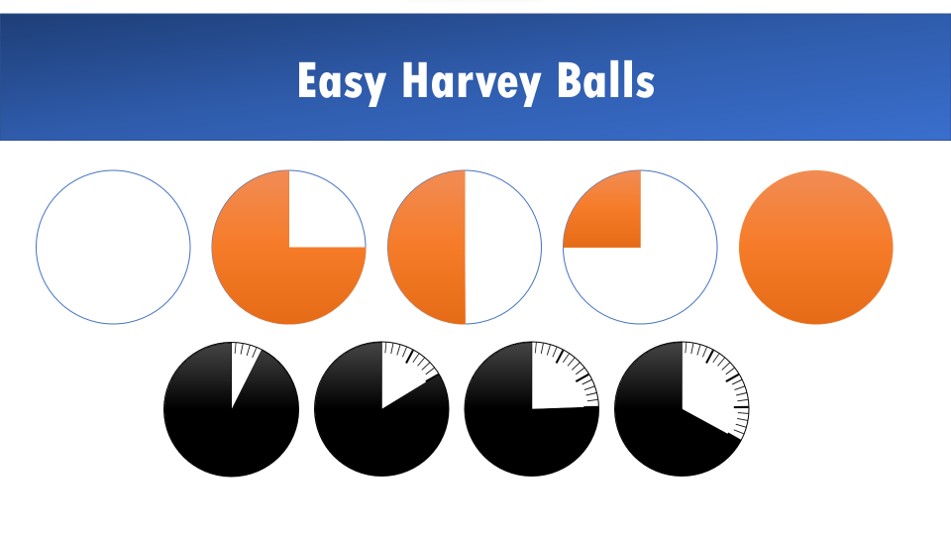
Step 2: Create variations
You can change the angle of the pie by moving the yellow handles. When you create a series of pies with different percentage fills, you may use them as templates for your report tables:

If you want Harvey balls shapes with smaller angles you can use a dial in the background as shown here:

You can download a dial icon by searching through any public domain images. It is this simple to create this icons with Harvey balls PowerPoint tutorial.
Related: Create 3D Radial diagram with Smartart
Variations for the diagram
When you make your business slides visual by using relevant diagrams and charts, you make it easy for your audience to remember your message. However, it takes a lot of time and effort to create professional looking graphics and diagrams from scratch. That is why we came up with our ‘PowerPoint 2 CEO Packs Bundle’.
The bundle has more than 1600 premium charts, graphs, graphics and diagrams to help you visualize every business idea imaginable. Just choose the template that matches your thought and replace the sample text with your own text. Your business slides get ready in no time.
Here are some variations of a project phases diagram from this bundle:
1) Editable Project Percentage completion Dials

PowerPoint Project Timeline Template
2. Project Completion Roadmap Dials

PowerPoint Project Timeline Template
3) Editable Filled Sphere Charts showing percentages

The above template comes with various options. So you can select and use the percentage of fill that you actually need.
4) Creative Thermometers showing fill comparison

As you can see, if you are a business presenter, who doesn’t have the time to create professional quality graphics for yourself, this bundle is an elegant solution for you. We recommend you take a look at our ‘2 CEO Packs Bundle‘ here.
Why waste time creating your graphics and charts from scratch, when you have such elegant solution available off the shelf?
If you found this Harvey Balls PowerPoint tutorial useful, do look around our site. You will find 250+ such advanced PowerPoint tutorials.
Related: Ideas for Project Management Charts