Part of : 320+ Visual PowerPoint Graphs Pack
Widest Variety of Data-Driven Graphs & Infographics for PowerPoint
Data-Driven Bottle Infographic
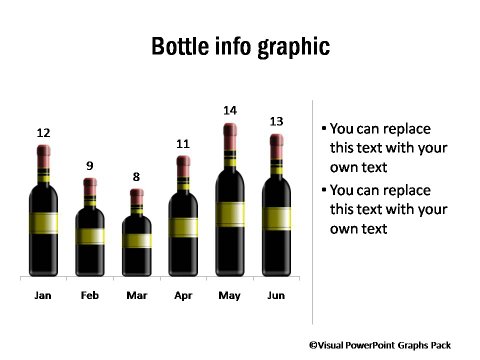
Description: Interesting Pictographs are used as metaphors to represent data including pencil graphic, pills graphics etc. to use in a range of industries and situations like healthcare, real estate, education etc. These easy to use graphs are fully data-driven.
|
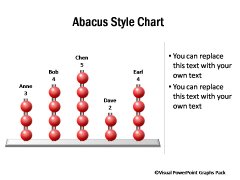
Abacus Style Chart
|
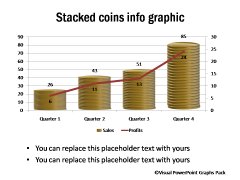
Stacked Coins Info graphic
|
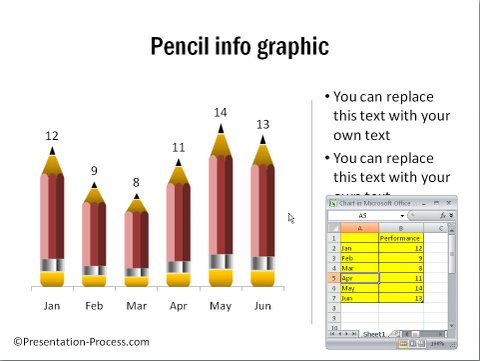
Pencil Infographic (with data being edited in worksheet)
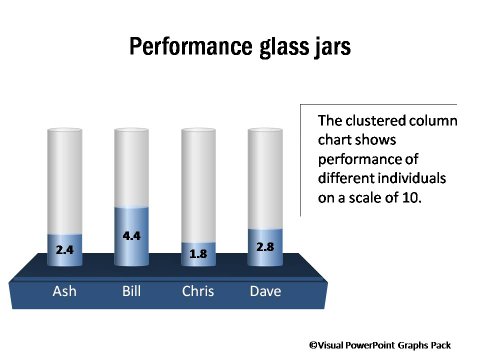
Data-Driven Performance Glass Jars
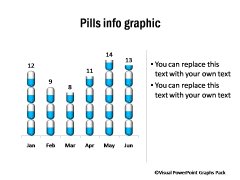
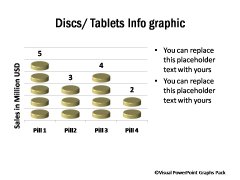
Pills or Tablets Infographic
 |
 |
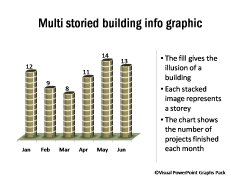
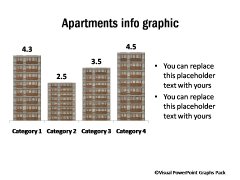
Building / Apartment Pictographs
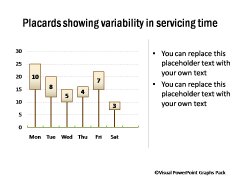
Placards showing Variability
|
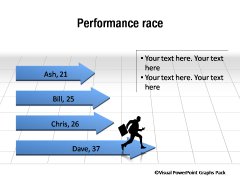
Performance Race
|
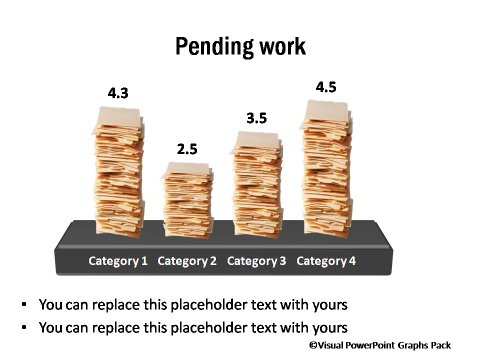
Pending Work shown in graph
