Currency Composition

Part of : 320+ Visual PowerPoint Graphs Pack

Widest Variety of Data-Driven Graphs & Infographics for PowerPoint

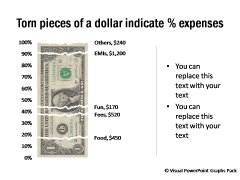
Currency Composition in Dollar Bill
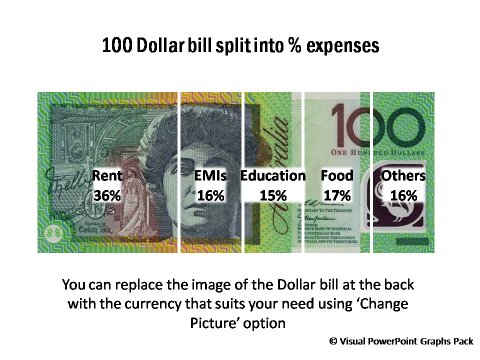
Currency Composition

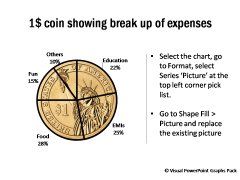
Description: Pie charts and Column Charts show the breakup for expenditure in currency note or coin format. The chart gives context to the numbers. Data visualization makes your presentations stand out. You can easily replace the coin or currency note and change the labels as per your requirement.

Break up of Expenses with Currency Notes
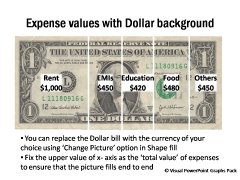
Currency Break up for Dollar bill

Pie Chart with Visual of a Coin

Coin Pie Chart

Expenses Break up with Dollar Bill

Coin Showing Break Up

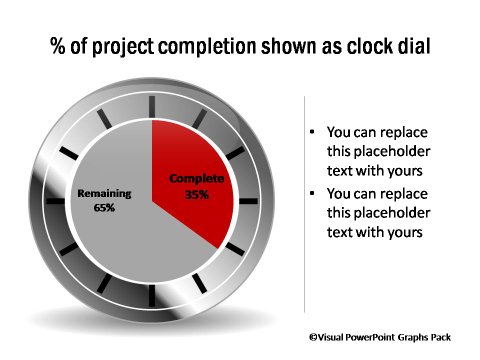
Percentage Completion Dials

Related Templates from Graphs Pack:

Percentage Completion Dials

Percentage Completion Dials

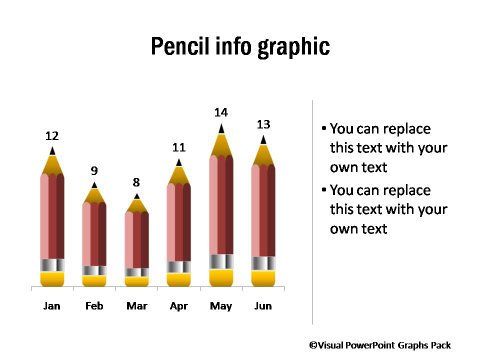
Data-Driven Pictographs

Pictogram of Pencil

NEXT STEPS:

Go to Gallery of Visual PowerPoint PackView Demo of Visual Graphs PackPricing of Graphs Pack

Return to Top of Visual Graphs Pack Sub Page

Share these tips & tutorials

Get 25 Creative PowerPoint Ideas Mini Course &
 Members-only tips & offers. Sign up for free below: