Part of : 320+ Visual PowerPoint Graphs Pack
Widest Variety of Data-Driven Graphs & Infographics for PowerPoint
PowerPoint Graphs pack helps business presenters create high quality charts and graphs quickly and easily. Here are answers to some of the questions you may have in your mind:
How do I edit the Graphs in the pack?
Follow these 2 simple steps:
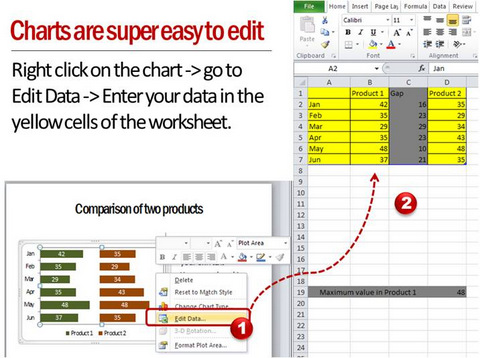
- Right click on the numbers or percentages in the chart and go to ‘Edit data’
- Enter your values in the yellow cells and see the chart update instantly

That is all. The pack makes Charts and Graphs accessible to everyone, irrespective of their comfort with spreadsheet programs.
Can I resize the charts?
Of course, you can resize charts by dragging their corner tabs as you do with any chart. So, the charts can fit into any dashboard or reports you already create. You can even copy different charts onto one slide and make a customized dashboard in minutes.
Can I animate the charts?
Absolutely YES! Here are the steps:
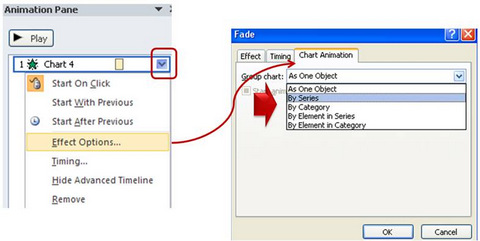
- Select the chart -> Go to Custom Animation tab and choose the ‘Entrance effect’ you want. For example, you may choose ‘Fade’ effect.
- Click on the drop down menu in the custom animation pane and select ‘Effect options’
- Select ‘Chart animation’ and animate the chart by Series, by Category, by Elements in Series or by Elements in category.

When you present your data in incremental steps, the numbers in your chart convey a powerful story.
Are the charts scalable?
Yes. You can add more series or categories than what is given in the template. As long as you enter your data in the yellow area, other relevant details and numbers will be automatically calculated by the worksheet. So, your charts are scalable.
Can I change the look and feel of the charts?
You can change the fill color of columns, edit data labels or edit your charts in whichever way you want. This gives you full control of the look and feel of your charts.
Can I save the charts as pictures?
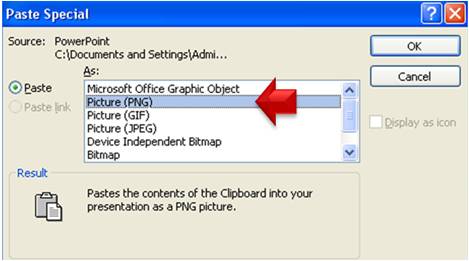
Yes. You can ‘copy’ any of the charts in the pack and use ‘Paste Special’ option to paste it as picture in ‘PNG’ or “JPEG’ format.

This allows you to update the same chart each week with fresh data. Since you saved the earlier charts as pictures, you can retrieve them any time and track your progress.
NEXT STEPS:
Features | License Terms | Testimonials | Download Samples| Contact Us
Features | License Terms | Contact Us | Download samples | Testimonials
