Home > All 2010 2007 Tutorials > Infographics> Info graph
Discover the power of PowerPoint graph in expressing your data visually. Create a simple visual graph using Shopping bag icon as the base element.
The Info graph you’ll learn to create is:
![]()
A visual graphic presents data in a visually interesting way. The elements used in the graph provide an immediate context to the audience and make the message memorable. Such graphs are far more effective in garnering and retaining audience attention than the usual boring bar and pie charts.
In the example shown above, we used a simple shopping bag icon to represent the number of customers in the data base of a large supermarket store. Since a shopping bag is useful to convey a variety of business concepts, we will first learn to create the shopping bag icon and later learn to use it as an element in visual graphs.
Components of shopping bag icon:
A shopping bag icon is comprised of 3 simple elements which can be created easily using basic auto shapes tools in PowerPoint. The shapes are:
![]() Step 1: Create the bag
Step 1: Create the bag
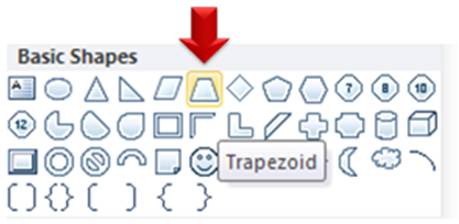
Go to Auto shapes menu, choose ‘Trapezoid’ tool.
 Draw the shape of the bag. Adjust the angles of the shape by working with the yellow diamond handles at the top edge.
Use ‘Fill Color’ option to give the bag a natural look.
![]() Use Tan, Background 2, Darker 50% as fill color. Once you select the color, go to Gradient -> Variations -> Linear up. The result will be as follows:
Use Tan, Background 2, Darker 50% as fill color. Once you select the color, go to Gradient -> Variations -> Linear up. The result will be as follows:
 Related: Professional Gradient effects in PowerPoint
Step 2: Draw the handle
Go to Auto shapes menu and select the Block Arc tool.
 Draw the shape, adjust the curvature and fill it with black color.
![]() Place the handle along the top edge of the bag. Leave some space along the top edge as shown below:
Place the handle along the top edge of the bag. Leave some space along the top edge as shown below:
![]() Step 3: Draw the rings
Step 3: Draw the rings
The last step is to draw the small rings that hold the handle strings for the icon.
Go to Auto shapes menu. Use the ‘oval’ tool. Draw a small circle while holding the ‘Shift’ tab. Fill the shape with ‘White’ color. Let the outline ( Right Click>Format Shape> Line Color) be ‘Black’. Increase the thickness of the outline if needed.
Make a copy of the ring and place them at the bottom edge of the handles. Right click on the shapes and choose ‘Send Backward’ option to place the rings between the handle and the bag. Your Shopping bag icon is ready:
 Related: Simple tutorial to create icons
Using the bag icon in the info graph:
You can resize the bag icon to reflect the data you want to represent. To make the task easy, first draw the grid lines at the background of the slide. Drag the shape along the corners to retain the shape of the bag. Mention the data labels with exact values to help your audience.
The final result will be a info graph you will be proud of:
![]() Related: Data Presentation Tips
Related: Data Presentation Tips
Inspiration for more innovative visual graphs:
We wish to show you some interesting options to serve as an inspiration for creating visual graphs in your business presentations. The following graph templates are part of our ‘750 + PowerPoint charts and Graphs templates pack for CEOs’.
Source: Editable PowerPoint Charts from CEO Pack
Our CEO templates pack has a wide variety of diagrams and visual graph options to help you express your business ideas and concepts in a clear and memorable way. Here are more examples from the pack:
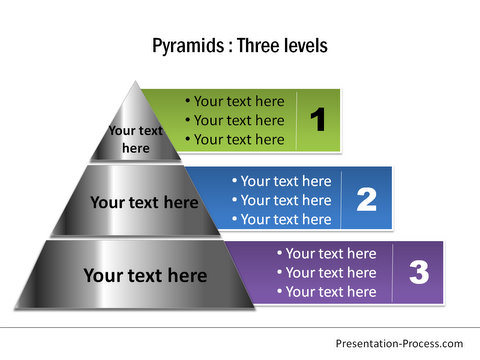
Editable Pyramid charts from CEO Pack Diagrams from CEO Pack
All you need is to copy our diagrams to your slide deck and replace the sample text with your own text. If you want to customize our PowerPoint graphs, you just need to replace the sample data with your own data. You can save hours creating your presentations and leave a lasting impression in the minds of your audience.
If you are a business presenter, we urge you to take a look at our diagrams pack. It would probably be one of the smartest business investments you will make this year.
If you liked this article, please leave a comment below. You can also share it with your friends…
Related: Pencil Icon Infographic
Related: 5 BIG lies in data presentation


